Mapped to the ESAT specification
NSAA 2020 Biology Part D
17 questions17 marksUpdated June 2026
Natural Sciences Admissions Assessment 2020 is one of the closest available past papers for the Engineering and Science Admissions Test. Below, all 17 questions are mapped to the ESAT topics they test, each with its answer. Sit it cold under exam timing, then work back through anything you missed using the solutions.
What this paper covers on the ESAT
Every question mapped to the Engineering and Science Admissions Test specification, so you know exactly which areas it tests.
Questions and answers are free. Full step-by-step worked solutions unlock with a free account. Start practising.
Question 61
1 markWhich of the following could lead to phenotypic variation between a father and his son?
1 time spent in sunlight
2 their genomes
3 their diets
1 time spent in sunlight
2 their genomes
3 their diets
- A.none of them
- B.1 only
- C.2 only
- D.3 only
- E.1 and 2 only
- F.1 and 3 only
- G.2 and 3 only
- H.1, 2 and 3
Answer: H
Question 62
1 markWhich of the following cells do not contain mitochondria?
1 bacterial cells
2 embryonic stem cells
3 mature red blood cells
4 potato cells
1 bacterial cells
2 embryonic stem cells
3 mature red blood cells
4 potato cells
- A.1 only
- B.2 only
- C.3 only
- D.4 only
- E.1 and 2 only
- F.1 and 3 only
- G.1 and 4 only
- H.2 and 4 only
Answer: F
Question 63
1 markA section of double-stranded DNA contains 4500 base pairs. 10% of the bases present are adenine.
Which of the following statements is/are correct?
1 There are 450 thymine bases present.
2 40% of the bases present are cytosine.
3 There are 3600 guanine bases present.
Which of the following statements is/are correct?
1 There are 450 thymine bases present.
2 40% of the bases present are cytosine.
3 There are 3600 guanine bases present.
- A.none of them
- B.1 only
- C.2 only
- D.3 only
- E.1 and 2 only
- F.1 and 3 only
- G.2 and 3 only
- H.1, 2 and 3
Answer: G
Question 64
1 markThe diagram shows part of the carbon cycle.
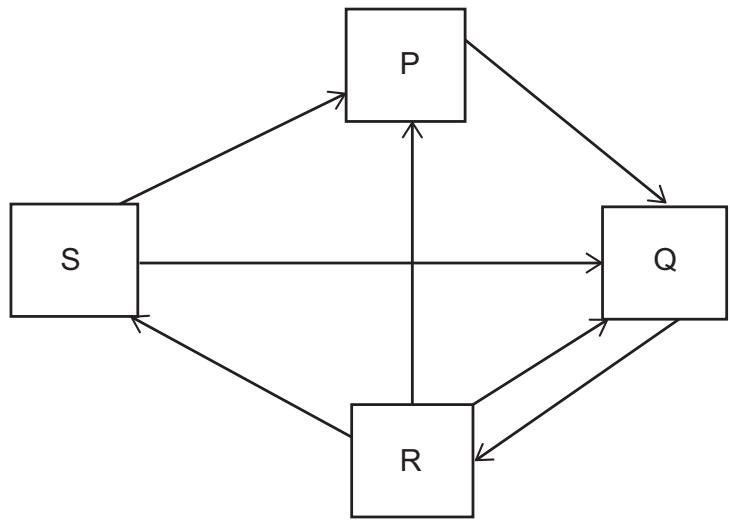
Which row identifies the correct descriptions for boxes P, Q, R and S?
Which row identifies the correct descriptions for boxes P, Q, R and S?
- A.CO2 in atmosphere: P, carbon-rich compounds in animals: Q, carbon-rich compounds in decomposers: R, carbon-rich compounds in plants: S
- B.CO2 in atmosphere: Q, carbon-rich compounds in animals: P, carbon-rich compounds in decomposers: S, carbon-rich compounds in plants: R
- C.CO2 in atmosphere: S, carbon-rich compounds in animals: Q, carbon-rich compounds in decomposers: R, carbon-rich compounds in plants: P
- D.CO2 in atmosphere: Q, carbon-rich compounds in animals: S, carbon-rich compounds in decomposers: P, carbon-rich compounds in plants: R
- E.CO2 in atmosphere: S, carbon-rich compounds in animals: R, carbon-rich compounds in decomposers: Q, carbon-rich compounds in plants: P
- F.CO2 in atmosphere: R, carbon-rich compounds in animals: S, carbon-rich compounds in decomposers: P, carbon-rich compounds in plants: Q
- G.CO2 in atmosphere: P, carbon-rich compounds in animals: R, carbon-rich compounds in decomposers: Q, carbon-rich compounds in plants: S
- H.CO2 in atmosphere: R, carbon-rich compounds in animals: P, carbon-rich compounds in decomposers: S, carbon-rich compounds in plants: Q
Answer: D
Question 65
1 markThe diagram shows two human gametes, cell P and cell Q, fusing to form cell R.
Cell P carries an additional copy of one of its chromosomes so that it has one more chromosome than cell Q.
Cell R divides to form two cells S and T.
S and T grow into two separate individuals.
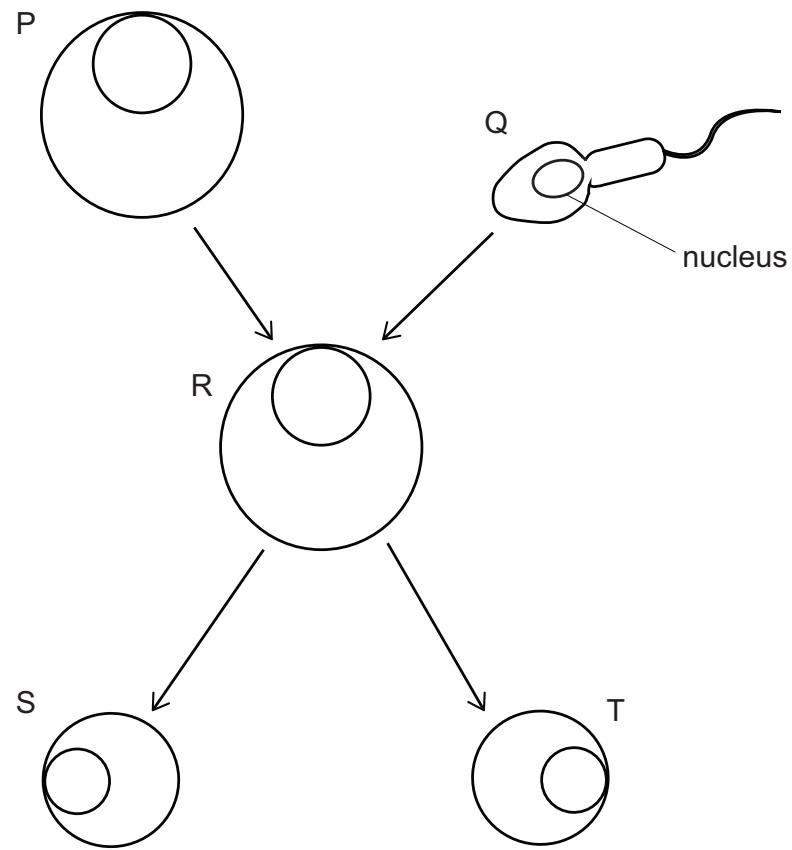
Using this information, which row shows the correct number of chromosomes in the nucleus of cell R and in the nucleus of cell T?
Cell P carries an additional copy of one of its chromosomes so that it has one more chromosome than cell Q.
Cell R divides to form two cells S and T.
S and T grow into two separate individuals.
Using this information, which row shows the correct number of chromosomes in the nucleus of cell R and in the nucleus of cell T?
- A.cell R: 23, cell T: 24
- B.cell R: 24, cell T: 47
- C.cell R: 24, cell T: 48
- D.cell R: 46, cell T: 46
- E.cell R: 47, cell T: 24
- F.cell R: 47, cell T: 47
- G.cell R: 92, cell T: 47
- H.cell R: 93, cell T: 93
Answer: F
Question 66
1 markPepsin and trypsin are both protease enzymes found in the human digestive system.
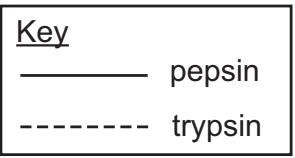
The graph shows how the activity of both enzymes varies with pH.
In the human digestive system:
1 pepsin is most active in the stomach.
2 trypsin would be inactive in the stomach.
3 pepsin could be a substrate for trypsin.
4 pepsin is most active at low acidity and trypsin most active at high acidity.
Which statements are correct?
The graph shows how the activity of both enzymes varies with pH.
In the human digestive system:
1 pepsin is most active in the stomach.
2 trypsin would be inactive in the stomach.
3 pepsin could be a substrate for trypsin.
4 pepsin is most active at low acidity and trypsin most active at high acidity.
Which statements are correct?
- A.1 and 2 only
- B.1 and 3 only
- C.1 and 4 only
- D.2 and 3 only
- E.2 and 4 only
- F.3 and 4 only
- G.1, 2 and 3 only
- H.2, 3 and 4 only
Answer: G
Question 67
1 markThe table shows concentrations of substances in blood entering and leaving three different organs of a person:
• kidney
• small intestine
• chambers of the right side of the heart
The blood sample was taken 10 minutes after the person had eaten a carbohydrate-rich meal.
Which row in the following table identifies the organs?
• kidney
• small intestine
• chambers of the right side of the heart
The blood sample was taken 10 minutes after the person had eaten a carbohydrate-rich meal.
Which row in the following table identifies the organs?
- A.organ 1: kidney, organ 2: small intestine, organ 3: chambers of the right side of the heart
- B.organ 1: kidney, organ 2: chambers of the right side of the heart, organ 3: small intestine
- C.organ 1: small intestine, organ 2: kidney, organ 3: chambers of the right side of the heart
- D.organ 1: small intestine, organ 2: chambers of the right side of the heart, organ 3: kidney
- E.organ 1: chambers of the right side of the heart, organ 2: small intestine, organ 3: kidney
- F.organ 1: chambers of the right side of the heart, organ 2: kidney, organ 3: small intestine
Answer: F
Question 68
1 markSCID is an inherited condition in humans.
In one type of SCID, the white blood cells are unable to make the functional enzyme ADA, which is necessary for these cells to divide by mitosis during an immune response.
Scientists have developed a gene therapy treatment whereby a gene is inserted into the DNA of stem cells taken from the bone marrow of a person with this condition. These cells can then be returned to the body of the person, and can divide and differentiate into white blood cells. If this gene therapy is successful, the number of white blood cells should increase significantly.
Which of the following statements correctly describe(s) how this method of gene therapy might work to help a person with this type of SCID?
1 Genetically altered stem cells differentiate into white blood cells that are able to produce functional ADA.
2 Genetically altered stem cells can differentiate into gametes so that offspring will not inherit SCID.
3 The sequence of the bases in the DNA of the white blood cells, derived from the genetically altered stem cells, has changed.
In one type of SCID, the white blood cells are unable to make the functional enzyme ADA, which is necessary for these cells to divide by mitosis during an immune response.
Scientists have developed a gene therapy treatment whereby a gene is inserted into the DNA of stem cells taken from the bone marrow of a person with this condition. These cells can then be returned to the body of the person, and can divide and differentiate into white blood cells. If this gene therapy is successful, the number of white blood cells should increase significantly.
Which of the following statements correctly describe(s) how this method of gene therapy might work to help a person with this type of SCID?
1 Genetically altered stem cells differentiate into white blood cells that are able to produce functional ADA.
2 Genetically altered stem cells can differentiate into gametes so that offspring will not inherit SCID.
3 The sequence of the bases in the DNA of the white blood cells, derived from the genetically altered stem cells, has changed.
- A.1 only
- B.2 only
- C.3 only
- D.1 and 2 only
- E.1 and 3 only
- F.2 and 3 only
- G.1, 2 and 3
Answer: F
Question 69
1 markWhich of the following could be a result of the addition of a large amount of organic material into a slow flowing river?
1 A decrease in biodiversity in the river.
2 A reduction in the oxygen concentration gradient between the air and the water.
3 An increase in the size of at least one aquatic population.
1 A decrease in biodiversity in the river.
2 A reduction in the oxygen concentration gradient between the air and the water.
3 An increase in the size of at least one aquatic population.
- A.none of them
- B.1 only
- C.2 only
- D.3 only
- E.1 and 2 only
- F.1 and 3 only
- G.2 and 3 only
- H.1, 2 and 3
Answer: C
Question 70
1 markThe table shows information about a human genetic condition called sickle cell anaemia and an infection called malaria. Both sickle cell anaemia and malaria can be fatal.
Which of the following statements is/are correct?
1 In areas without malaria, human populations are likely to have a low number of people with the m allele.
2 In areas with malaria, only those individuals that are heterozygous will be able to pass on their alleles to the next generation.
3 Presence of malaria has caused a mutation of the M allele to the m allele leading to an increased chance of survival in the heterozygous state.
Which of the following statements is/are correct?
1 In areas without malaria, human populations are likely to have a low number of people with the m allele.
2 In areas with malaria, only those individuals that are heterozygous will be able to pass on their alleles to the next generation.
3 Presence of malaria has caused a mutation of the M allele to the m allele leading to an increased chance of survival in the heterozygous state.
- A.none of them
- B.1 only
- C.2 only
- D.3 only
- E.1 and 2 only
- F.1 and 3 only
- G.2 and 3 only
- H.1, 2 and 3
Answer: B
Question 71
1 markThe table shows the concentration of potassium ions in several different locations.
| location | concentration of potassium ions |
| :--- | :--- |
| bacterial cell cytoplasm | |
| mammalian blood plasma | |
| mammalian heart cell cytoplasm | |
| sea water | |
| yeast cell cytoplasm | |
Which of the following statements is/are correct?
1 A mammalian heart cell needs energy from respiration in order to obtain more potassium ions from blood plasma.
2 If a yeast cell is placed in sea water then it will lose potassium ions by osmosis.
3 There is no concentration gradient for potassium ions between a bacterial cell and sea water.
| location | concentration of potassium ions |
| :--- | :--- |
| bacterial cell cytoplasm | |
| mammalian blood plasma | |
| mammalian heart cell cytoplasm | |
| sea water | |
| yeast cell cytoplasm | |
Which of the following statements is/are correct?
1 A mammalian heart cell needs energy from respiration in order to obtain more potassium ions from blood plasma.
2 If a yeast cell is placed in sea water then it will lose potassium ions by osmosis.
3 There is no concentration gradient for potassium ions between a bacterial cell and sea water.
- A.none of them
- B.1 only
- C.2 only
- D.3 only
- E.1 and 2 only
- F.1 and 3 only
- G.2 and 3 only
- H.1, 2 and 3
Answer: C
Question 72
1 markThe graph shows the mass of product produced over time for an enzyme-controlled reaction in two different conditions, X and Y. All other variables were kept constant.
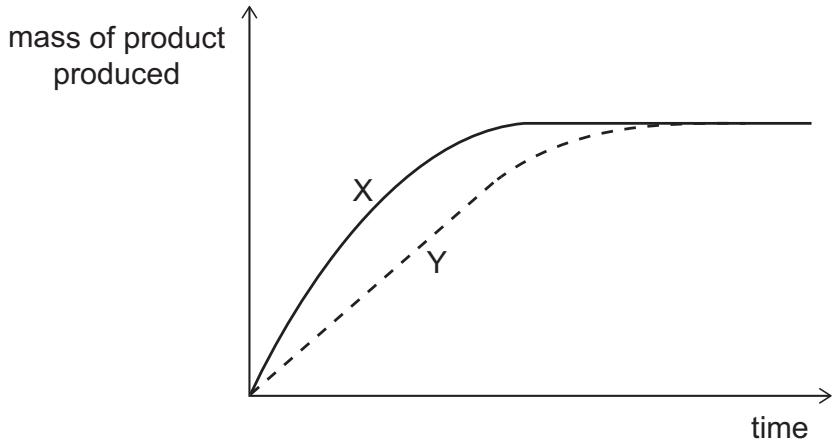
Which of the following could be correct for this graph?
1 Condition X is a higher pH than condition Y.
2 Condition X has less substrate supplied than condition Y.
3 Condition X is a lower pH than condition Y.
4 Condition X has more substrate supplied than condition Y.
Which of the following could be correct for this graph?
1 Condition X is a higher pH than condition Y.
2 Condition X has less substrate supplied than condition Y.
3 Condition X is a lower pH than condition Y.
4 Condition X has more substrate supplied than condition Y.
- A.none of them
- B.1 and 2 only
- C.1 and 3 only
- D.1 and 4 only
- E.2 and 3 only
- F.2 and 4 only
- G.3 and 4 only
- H.1, 2, 3 and 4
Answer: C
Question 73
1 markA student investigated the endothermic reaction of photosynthesis in pondweed. The student set up the apparatus as shown in the diagram.
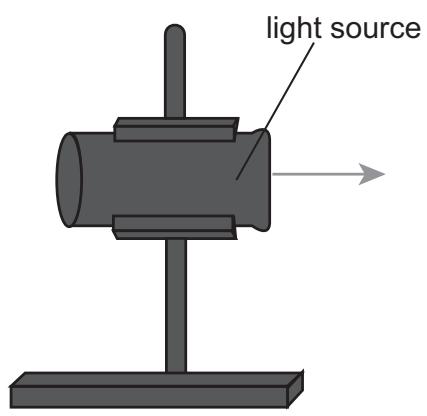
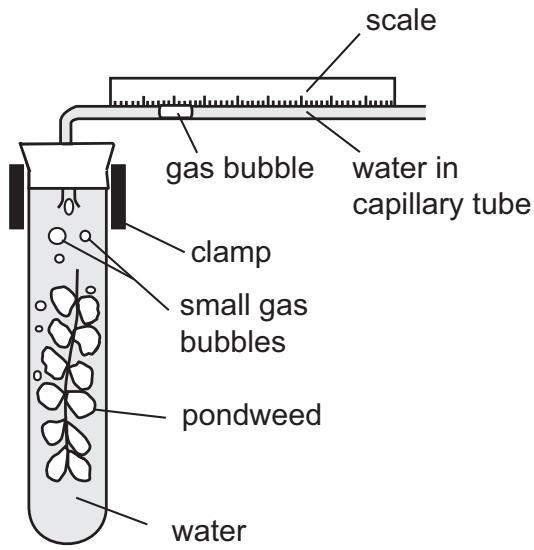
The experiment was left for 5 minutes and the distance moved by the gas bubble along a capillary tube of 2 mm diameter was recorded. Using these values, the rate of gas production is per minute.
Which row of the table is correct?
The experiment was left for 5 minutes and the distance moved by the gas bubble along a capillary tube of 2 mm diameter was recorded. Using these values, the rate of gas production is per minute.
Which row of the table is correct?
- A.total distance moved by the gas bubble during the experiment / mm: 0.5, reason why the reaction is described as endothermic: the reaction releases energy, observations if the light source was moved further from the pondweed: the gas bubble moves more slowly to the right
- B.total distance moved by the gas bubble during the experiment / mm: 0.5, reason why the reaction is described as endothermic: the reaction takes in energy, observations if the light source was moved further from the pondweed: the gas bubble moves more slowly to the left
- C.total distance moved by the gas bubble during the experiment / mm: 2.0, reason why the reaction is described as endothermic: the reaction releases energy, observations if the light source was moved further from the pondweed: the gas bubble moves more slowly to the left
- D.total distance moved by the gas bubble during the experiment / mm: 2.0, reason why the reaction is described as endothermic: the reaction releases energy, observations if the light source was moved further from the pondweed: the gas bubble moves more slowly to the right
- E.total distance moved by the gas bubble during the experiment / mm: 2.5, reason why the reaction is described as endothermic: the reaction takes in energy, observations if the light source was moved further from the pondweed: the gas bubble moves more slowly to the left
- F.total distance moved by the gas bubble during the experiment / mm: 2.5, reason why the reaction is described as endothermic: the reaction takes in energy, observations if the light source was moved further from the pondweed: the gas bubble moves more slowly to the right
- G.total distance moved by the gas bubble during the experiment / mm: 10.0, reason why the reaction is described as endothermic: the reaction releases energy, observations if the light source was moved further from the pondweed: the gas bubble moves more slowly to the left
- H.total distance moved by the gas bubble during the experiment / mm: 10.0, reason why the reaction is described as endothermic: the reaction takes in energy, observations if the light source was moved further from the pondweed: the gas bubble moves more slowly to the right
Answer: H
Question 74
1 markThe abundance of a plant species in a habitat can be measured in different ways:
• the density (the number of that plant species per )
• the frequency (the number of quadrats in which the plant species occurs)
The abundance of a plant species in a area of grassland was measured. The diagram below represents this area of grassland. Each black circle represents one individual of the plant species in this area of grassland.
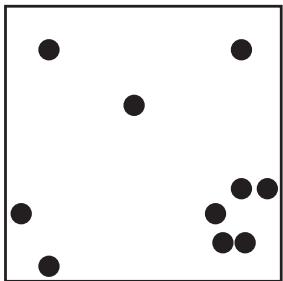
Two different size quadrats were used to sample the area:
• large quadrat ()
• small quadrat ()
The area is sampled randomly, first using 10 large quadrats and then a second time using 10 small quadrats.
Which of the following statements is/are correct?
1 The overall density in the grassland calculated from sampling with either size quadrat will always be the same.
2 The overall density in the grassland calculated from sampling will always be 1 plant per .
3 The frequency obtained using the small quadrat will always be lower than that obtained with the large quadrat.
• the density (the number of that plant species per )
• the frequency (the number of quadrats in which the plant species occurs)
The abundance of a plant species in a area of grassland was measured. The diagram below represents this area of grassland. Each black circle represents one individual of the plant species in this area of grassland.
Two different size quadrats were used to sample the area:
• large quadrat ()
• small quadrat ()
The area is sampled randomly, first using 10 large quadrats and then a second time using 10 small quadrats.
Which of the following statements is/are correct?
1 The overall density in the grassland calculated from sampling with either size quadrat will always be the same.
2 The overall density in the grassland calculated from sampling will always be 1 plant per .
3 The frequency obtained using the small quadrat will always be lower than that obtained with the large quadrat.
- A.none of them
- B.1 only
- C.2 only
- D.3 only
- E.1 and 2 only
- F.2 and 3 only
- G.1 and 3 only
- H.1, 2 and 3
Answer: A
Question 75
1 markThe diagram shows the changes in the volume of the ventricles, and the ECG trace that accompanies those changes, during two consecutive heart beats.
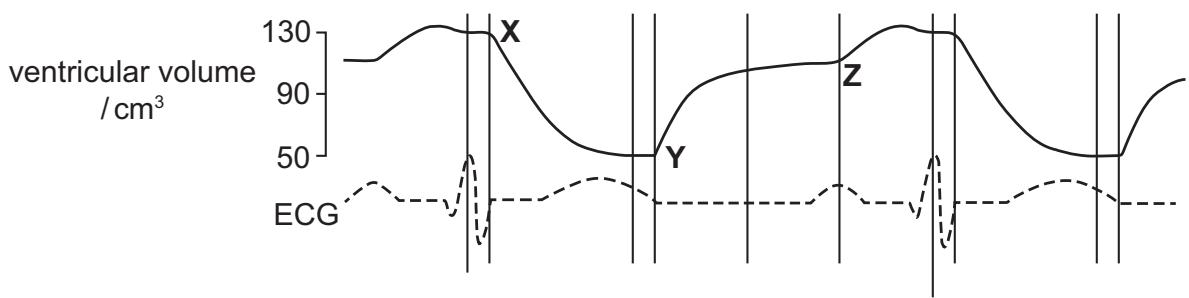
Which row is correct about the events happening at X, Y and Z?
Which row is correct about the events happening at X, Y and Z?
- A.at X blood is being pumped into: aorta, at Y valves between atria and ventricles are: open, chambers of the heart contracting at Z: atria
- B.at X blood is being pumped into: aorta, at Y valves between atria and ventricles are: closed, chambers of the heart contracting at Z: atria
- C.at X blood is being pumped into: atria, at Y valves between atria and ventricles are: open, chambers of the heart contracting at Z: ventricles
- D.at X blood is being pumped into: atria, at Y valves between atria and ventricles are: closed, chambers of the heart contracting at Z: ventricles
- E.at X blood is being pumped into: pulmonary artery, at Y valves between atria and ventricles are: open, chambers of the heart contracting at Z: ventricles
- F.at X blood is being pumped into: pulmonary artery, at Y valves between atria and ventricles are: closed, chambers of the heart contracting at Z: ventricles
- G.at X blood is being pumped into: pulmonary vein, at Y valves between atria and ventricles are: open, chambers of the heart contracting at Z: atria
- H.at X blood is being pumped into: pulmonary vein, at Y valves between atria and ventricles are: closed, chambers of the heart contracting at Z: atria
Answer: A
Question 76
1 markThe placenta is an organ that develops during pregnancy. One function of the placenta is to allow the exchange of gases between the mother and the developing foetus.
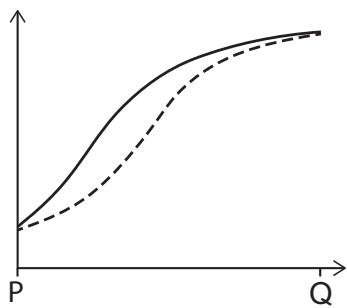
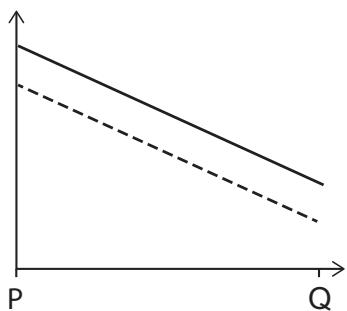
The diagram represents the maternal and foetal blood flow between P and Q in a section of the placenta of a healthy small mammal. The concentration of oxygen in both maternal and foetal blood was measured at regular distances along this section.
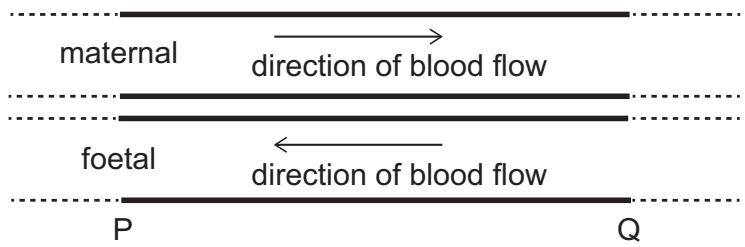
Which graph illustrates the concentration of oxygen in both maternal and foetal blood between P and Q?
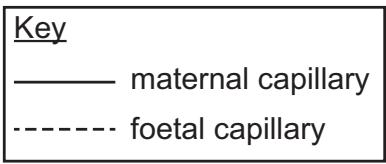
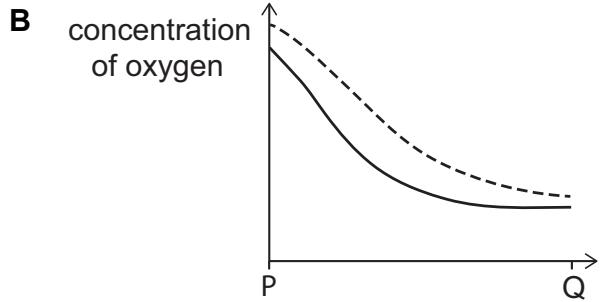
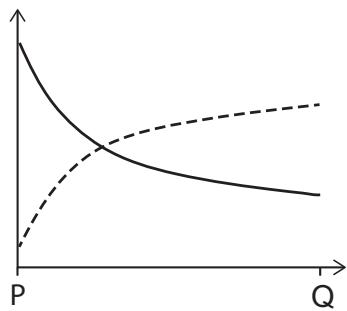
The diagram represents the maternal and foetal blood flow between P and Q in a section of the placenta of a healthy small mammal. The concentration of oxygen in both maternal and foetal blood was measured at regular distances along this section.
Which graph illustrates the concentration of oxygen in both maternal and foetal blood between P and Q?
- A.Graph A
- B.Graph B
- C.Graph C
- D.Graph D
- E.Graph E
- F.Graph F
Answer: C
Question 77
1 markCatalase is an enzyme found inside plant and animal cells. When catalase is added to hydrogen peroxide, bubbles of oxygen gas are formed.
Red blood cells were placed into either water or plasma, and were placed in the dark.
Plant cells were placed into either water or sucrose solution, and were placed in the dark.
Assume that hydrogen peroxide and catalase do not cross the cell surface membrane.
Which row shows the results when hydrogen peroxide was added?
Key
✓ = oxygen bubbles will form
x = oxygen bubbles will not form
Red blood cells were placed into either water or plasma, and were placed in the dark.
Plant cells were placed into either water or sucrose solution, and were placed in the dark.
Assume that hydrogen peroxide and catalase do not cross the cell surface membrane.
Which row shows the results when hydrogen peroxide was added?
Key
✓ = oxygen bubbles will form
x = oxygen bubbles will not form
- A.red blood cells in plasma: ✓, plant cells in a 0.5 mol dm⁻³ sucrose solution: ✓, red blood cells in water: x, plant cells in water: x
- B.red blood cells in plasma: x, plant cells in a 0.5 mol dm⁻³ sucrose solution: x, red blood cells in water: ✓, plant cells in water: ✓
- C.red blood cells in plasma: x, plant cells in a 0.5 mol dm⁻³ sucrose solution: ✓, red blood cells in water: ✓, plant cells in water: x
- D.red blood cells in plasma: x, plant cells in a 0.5 mol dm⁻³ sucrose solution: x, red blood cells in water: x, plant cells in water: ✓
- E.red blood cells in plasma: ✓, plant cells in a 0.5 mol dm⁻³ sucrose solution: ✓, red blood cells in water: ✓, plant cells in water: x
- F.red blood cells in plasma: ✓, plant cells in a 0.5 mol dm⁻³ sucrose solution: ✓, red blood cells in water: x, plant cells in water: ✓
Answer: C