Mapped to the ESAT specification
NSAA 2020 Biology Part Z
16 questions16 marksUpdated June 2026
Natural Sciences Admissions Assessment 2020 is one of the closest available past papers for the Engineering and Science Admissions Test. Below, all 16 questions are mapped to the ESAT topics they test, each with its answer. Sit it cold under exam timing, then work back through anything you missed using the solutions.
What this paper covers on the ESAT
Every question mapped to the Engineering and Science Admissions Test specification, so you know exactly which areas it tests.
Mathematics 1
- Algebra (6)
- Geometry (4)
- Ratio and proportion (2)
Chemistry
- Rates of reaction (2)
Biology
- Animal physiology (7)
- Cell division and sex determination (6)
- Inheritance (4)
- DNA (3)
- Cells (2)
- Enzymes (2)
- Gene technologies (2)
- Movement across membranes (2)
- Ecosystems (1)
- Plant physiology (1)
Questions and answers are free. Full step-by-step worked solutions unlock with a free account. Start practising.
Question 41
1 markThe diagram shows the inheritance of a characteristic controlled by a single gene. Two organisms reproduce sexually and have four offspring, one offspring at a time.
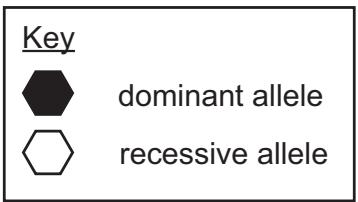
Key
- Filled hexagon: dominant allele
- Unfilled hexagon: recessive allele
The diagram shows a pedigree chart. The first generation consists of a male with a dominant phenotype (filled hexagon) and a female with a recessive phenotype (unfilled hexagon). They have four offspring in the second generation: a female with a dominant phenotype, a male with a dominant phenotype (labelled T), a female with a recessive phenotype, and a male with a dominant phenotype.
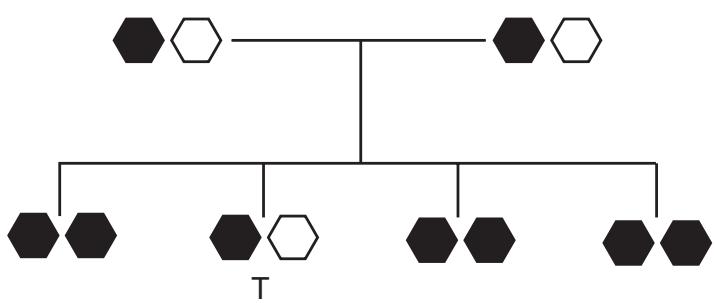
Individual T goes on to have a single offspring with an unrelated individual who has a recessive phenotype. The offspring of T has a dominant phenotype.
What is the ratio of dominant to recessive alleles for all of the individuals in this diagram, as well as T's mate and their one offspring?
Key
- Filled hexagon: dominant allele
- Unfilled hexagon: recessive allele
The diagram shows a pedigree chart. The first generation consists of a male with a dominant phenotype (filled hexagon) and a female with a recessive phenotype (unfilled hexagon). They have four offspring in the second generation: a female with a dominant phenotype, a male with a dominant phenotype (labelled T), a female with a recessive phenotype, and a male with a dominant phenotype.
Individual T goes on to have a single offspring with an unrelated individual who has a recessive phenotype. The offspring of T has a dominant phenotype.
What is the ratio of dominant to recessive alleles for all of the individuals in this diagram, as well as T's mate and their one offspring?
- A.3:5
- B.5:3
- C.7:1
- D.1:7
- E.3:1
- F.1:3
- G.2:1
- H.1:2
Answer: B
Question 42
1 markThe average healthy mature red blood cell contains 200 000 000 molecules of haemoglobin.
If a red blood cell is saturated with dissolved oxygen, each haemoglobin molecule carries a total of 4 molecules of oxygen.
Haemoglobin molecules in red blood cells in the pulmonary artery are on average 65% saturated with oxygen.
How many oxygen molecules are carried by the average red blood cell in the pulmonary artery, and is the level of oxygen saturation greater in the aorta or the pulmonary artery?
If a red blood cell is saturated with dissolved oxygen, each haemoglobin molecule carries a total of 4 molecules of oxygen.
Haemoglobin molecules in red blood cells in the pulmonary artery are on average 65% saturated with oxygen.
How many oxygen molecules are carried by the average red blood cell in the pulmonary artery, and is the level of oxygen saturation greater in the aorta or the pulmonary artery?
- A.number of oxygen molecules carried: , level of oxygen saturation: aorta > pulmonary artery
- B.number of oxygen molecules carried: , level of oxygen saturation: aorta < pulmonary artery
- C.number of oxygen molecules carried: , level of oxygen saturation: aorta > pulmonary artery
- D.number of oxygen molecules carried: , level of oxygen saturation: aorta < pulmonary artery
- E.number of oxygen molecules carried: , level of oxygen saturation: aorta > pulmonary artery
- F.number of oxygen molecules carried: , level of oxygen saturation: aorta < pulmonary artery
- G.number of oxygen molecules carried: , level of oxygen saturation: aorta > pulmonary artery
- H.number of oxygen molecules carried: , level of oxygen saturation: aorta < pulmonary artery
Answer: C
Question 43
1 markGraphs P and Q were plotted using data collected in an investigation into the effect of temperature from 0 to 60 °C on an enzyme-controlled reaction. All other variables were controlled.
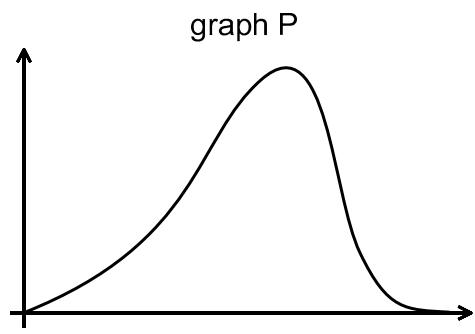
Graph P shows a curve that starts at the origin, increases to a peak, and then decreases.
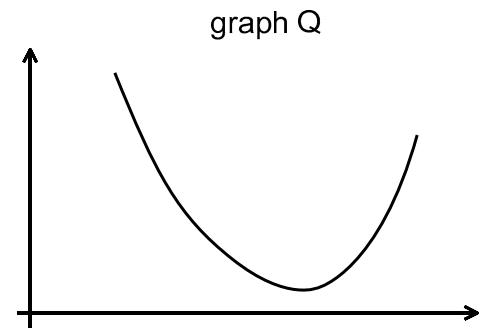
Graph Q shows a curve that starts high on the y-axis, decreases to a minimum, and then increases, forming a U-shape.
Which two rows correctly identify the variables plotted on the horizontal and vertical axes of these graphs?
| row | graph | horizontal axis | vertical axis |
|---|---|---|---|
| 1 | P | temperature | time taken for reaction |
| 2 | P | temperature | rate of reaction |
| 3 | P | time taken for reaction | temperature |
| 4 | P | time taken for reaction | rate of reaction |
| 5 | Q | temperature | time taken for reaction |
| 6 | Q | temperature | rate of reaction |
| 7 | Q | time taken for reaction | temperature |
| 8 | Q | time taken for reaction | rate of reaction |
Graph P shows a curve that starts at the origin, increases to a peak, and then decreases.
Graph Q shows a curve that starts high on the y-axis, decreases to a minimum, and then increases, forming a U-shape.
Which two rows correctly identify the variables plotted on the horizontal and vertical axes of these graphs?
| row | graph | horizontal axis | vertical axis |
|---|---|---|---|
| 1 | P | temperature | time taken for reaction |
| 2 | P | temperature | rate of reaction |
| 3 | P | time taken for reaction | temperature |
| 4 | P | time taken for reaction | rate of reaction |
| 5 | Q | temperature | time taken for reaction |
| 6 | Q | temperature | rate of reaction |
| 7 | Q | time taken for reaction | temperature |
| 8 | Q | time taken for reaction | rate of reaction |
- A.1 and 6
- B.1 and 7
- C.2 and 5
- D.2 and 6
- E.3 and 5
- F.3 and 8
- G.4 and 7
- H.4 and 8
Answer: C
Question 44
1 markA recessive condition is found within a human population. There were 5000 births in this population within one year. Of these births, 8% had the condition and 32% were homozygous dominant.
One healthy cheek cell is analysed from each person born in this year.
How many recessive alleles and dominant alleles are present?
(Assume that no new mutations occur.)
One healthy cheek cell is analysed from each person born in this year.
How many recessive alleles and dominant alleles are present?
(Assume that no new mutations occur.)
- A.recessive alleles: 400, dominant alleles: 1600
- B.recessive alleles: 400, dominant alleles: 4600
- C.recessive alleles: 3400, dominant alleles: 1600
- D.recessive alleles: 3400, dominant alleles: 4600
- E.recessive alleles: 3400, dominant alleles: 6200
- F.recessive alleles: 3800, dominant alleles: 1600
- G.recessive alleles: 3800, dominant alleles: 4600
- H.recessive alleles: 3800, dominant alleles: 6200
Answer: H
Question 45
1 markA study was carried out into the effect of liver protein Z on the risk of developing coronary heart disease, which is often associated with high blood cholesterol. Z binds to another protein in the membrane of liver cells that transports cholesterol from the blood into cells. This binding blocks the function of the transport protein.
Blood cholesterol levels were measured in three different groups of people. One group was a control group and contained no mutations in the gene for Z. The second group all had the same mutation in the gene (called mutation 1). This mutation occurs in the final section of the gene. A third group all had a different mutation in the gene (called mutation 2), but this was in the first section of the gene. The results are shown in the graph.
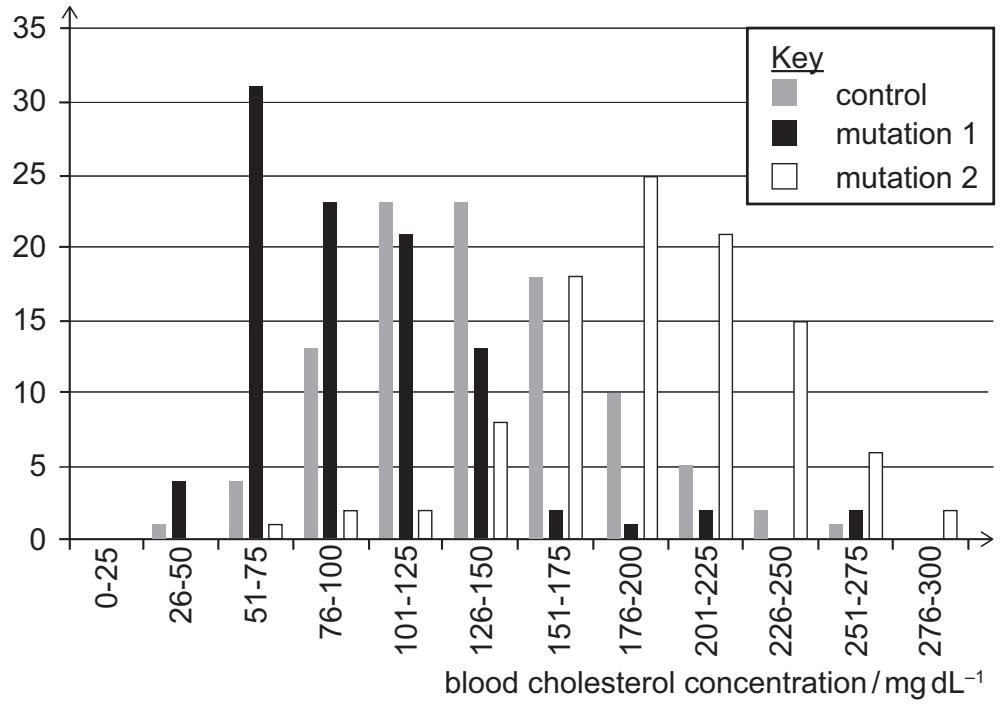
The graph is a bar chart showing 'percentage of people within each group' on the y-axis (from 0 to 35) and 'blood cholesterol concentration/mg dL⁻¹' on the x-axis in ranges (0-25, 26-50, etc., up to 276-300). There are three bars for each range, corresponding to 'control', 'mutation 1', and 'mutation 2'.
- The control group (black bars) has the highest percentages in the lower cholesterol ranges (e.g., 76-100, 101-125).
- The mutation 1 group (grey bars) has a distribution similar to the control group.
- The mutation 2 group (white bars) has the highest percentages in the higher cholesterol ranges (e.g., 151-175, 176-200, 201-225).
Which of the following can be correctly concluded from these results?
1 Changes in the first section of protein Z stop it from binding to the cholesterol transport protein.
2 Mutation 1 could result in an increase in the concentration of cholesterol inside liver cells.
3 Of the three groups, people in the control group are least likely to develop coronary heart disease.
Blood cholesterol levels were measured in three different groups of people. One group was a control group and contained no mutations in the gene for Z. The second group all had the same mutation in the gene (called mutation 1). This mutation occurs in the final section of the gene. A third group all had a different mutation in the gene (called mutation 2), but this was in the first section of the gene. The results are shown in the graph.
The graph is a bar chart showing 'percentage of people within each group' on the y-axis (from 0 to 35) and 'blood cholesterol concentration/mg dL⁻¹' on the x-axis in ranges (0-25, 26-50, etc., up to 276-300). There are three bars for each range, corresponding to 'control', 'mutation 1', and 'mutation 2'.
- The control group (black bars) has the highest percentages in the lower cholesterol ranges (e.g., 76-100, 101-125).
- The mutation 1 group (grey bars) has a distribution similar to the control group.
- The mutation 2 group (white bars) has the highest percentages in the higher cholesterol ranges (e.g., 151-175, 176-200, 201-225).
Which of the following can be correctly concluded from these results?
1 Changes in the first section of protein Z stop it from binding to the cholesterol transport protein.
2 Mutation 1 could result in an increase in the concentration of cholesterol inside liver cells.
3 Of the three groups, people in the control group are least likely to develop coronary heart disease.
- A.none of them
- B.1 only
- C.2 only
- D.3 only
- E.1 and 2 only
- F.1 and 3 only
- G.2 and 3 only
- H.1, 2 and 3
Answer: C
Question 46
1 markEqual-sized, rectangular blocks of a raw potato were cut and their mass measured. The blocks were then placed in equal volumes of different concentrations of sucrose solutions for the same length of time. All other variables were kept constant.
After this time, the blocks were blotted on paper and then their masses were measured again. The percentage change in mass of each block was calculated and the results are shown in the graph.
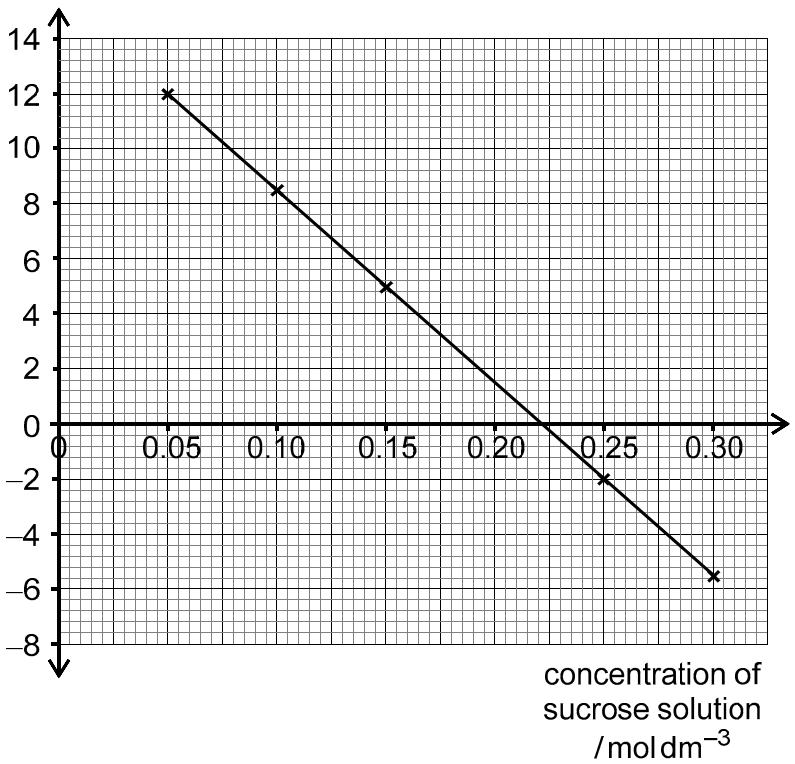
The graph shows 'percentage change in mass of potato block' on the y-axis (from -8 to 14) and 'concentration of sucrose solution / ' on the x-axis (from 0 to 0.30). The plotted points form a straight line with a negative gradient, crossing the x-axis at approximately 0.22 .
Which of the following statements is/are correct?
1 In 0.10 sucrose solution, there was some movement of sucrose molecules by osmosis across the membrane out of the potato block.
2 If the initial mass of the block in 0.25 sucrose solution is 1.800 g then its final mass will be 1.764 g.
3 Repeating the experiment at a temperature that was 10°C lower should not affect the point at which the graph crosses the x-axis.
After this time, the blocks were blotted on paper and then their masses were measured again. The percentage change in mass of each block was calculated and the results are shown in the graph.
The graph shows 'percentage change in mass of potato block' on the y-axis (from -8 to 14) and 'concentration of sucrose solution / ' on the x-axis (from 0 to 0.30). The plotted points form a straight line with a negative gradient, crossing the x-axis at approximately 0.22 .
Which of the following statements is/are correct?
1 In 0.10 sucrose solution, there was some movement of sucrose molecules by osmosis across the membrane out of the potato block.
2 If the initial mass of the block in 0.25 sucrose solution is 1.800 g then its final mass will be 1.764 g.
3 Repeating the experiment at a temperature that was 10°C lower should not affect the point at which the graph crosses the x-axis.
- A.none of them
- B.1 only
- C.2 only
- D.3 only
- E.1 and 2 only
- F.1 and 3 only
- G.2 and 3 only
- H.1, 2 and 3
Answer: G
Question 47
1 markThe table shows the sources of water lost in one particular day from a healthy human.
| percentage of the water that is lost | source |
|--------------------------------------|--------------|
| 16 | exhaled air |
| 4 | faeces |
| 20 | sweat |
| 60 | urine |
On another day, the percentage of water lost in urine decreased by a sixth.
The percentage of water lost in exhaled air and in faeces remained the same.
The total volume of water lost was 2500 on both days.
What is the percentage increase in the volume of sweat produced and the reason for the decrease in the volume of urine?
| percentage of the water that is lost | source |
|--------------------------------------|--------------|
| 16 | exhaled air |
| 4 | faeces |
| 20 | sweat |
| 60 | urine |
On another day, the percentage of water lost in urine decreased by a sixth.
The percentage of water lost in exhaled air and in faeces remained the same.
The total volume of water lost was 2500 on both days.
What is the percentage increase in the volume of sweat produced and the reason for the decrease in the volume of urine?
- A.percentage increase in the volume of sweat: 33, reason for the decrease in the volume of urine: a decrease in ADH
- B.percentage increase in the volume of sweat: 33, reason for the decrease in the volume of urine: an increase in ADH
- C.percentage increase in the volume of sweat: 50, reason for the decrease in the volume of urine: a decrease in ADH
- D.percentage increase in the volume of sweat: 50, reason for the decrease in the volume of urine: an increase in ADH
- E.percentage increase in the volume of sweat: 150, reason for the decrease in the volume of urine: a decrease in ADH
- F.percentage increase in the volume of sweat: 150, reason for the decrease in the volume of urine: an increase in ADH
Answer: D
Question 48
1 markThe diagram shows the production of sperm cells in a healthy mammal. Cell P divides. One daughter cell goes on to replace cell P, and the other daughter cell is called Q in the diagram.
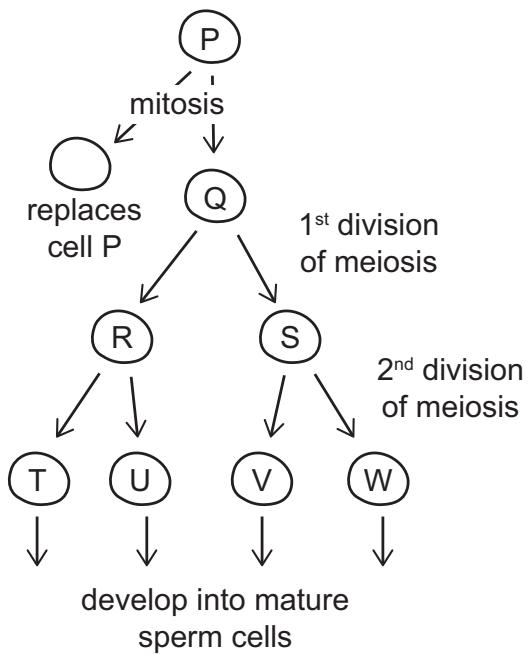
Diagram Flow:
- Cell P undergoes mitosis.
- One daughter cell replaces cell P.
- The other daughter cell is Q.
- Cell Q undergoes the 1st division of meiosis to form cells R and S.
- Cells R and S undergo the 2nd division of meiosis.
- Cell R forms cells T and U.
- Cell S forms cells V and W.
- Cells T, U, V, and W develop into mature sperm cells.
Each mitotic cell cycle takes 14 hours.
The diploid number of chromosomes in this mammal is 68.
Which of the following statements is/are correct?
1 Cell P is a type of stem cell.
2 Cells T, U, V and W each contain 23 chromosomes.
3 In 112 hours, 128 replacements of cell P are made.
Diagram Flow:
- Cell P undergoes mitosis.
- One daughter cell replaces cell P.
- The other daughter cell is Q.
- Cell Q undergoes the 1st division of meiosis to form cells R and S.
- Cells R and S undergo the 2nd division of meiosis.
- Cell R forms cells T and U.
- Cell S forms cells V and W.
- Cells T, U, V, and W develop into mature sperm cells.
Each mitotic cell cycle takes 14 hours.
The diploid number of chromosomes in this mammal is 68.
Which of the following statements is/are correct?
1 Cell P is a type of stem cell.
2 Cells T, U, V and W each contain 23 chromosomes.
3 In 112 hours, 128 replacements of cell P are made.
- A.none of them
- B.1 only
- C.2 only
- D.3 only
- E.1 and 2 only
- F.1 and 3 only
- G.2 and 3 only
- H.1, 2 and 3
Answer: E
Question 49
1 markIn the disease emphysema the walls of the alveoli break down so that several smaller alveoli fuse to form a single large alveolus.
The diagram shows a model of the effect of emphysema on spherical alveoli.
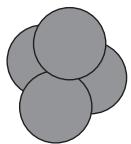
- 4 healthy alveoli are shown as a cluster of four spheres, with the radius of each alveolus = x.
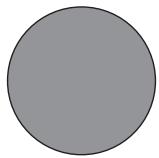
- 1 alveolus from a person with emphysema is shown as a single larger sphere, with a radius of alveolus = 2x.
Which of the following statements is/are correct?
1 The surface area-to-volume ratio of the four healthy alveoli is twice that of the single emphysema alveolus.
2 For the same concentration gradient, the rate of diffusion of oxygen into the blood from a single healthy alveolus will be greater than for a single emphysema alveolus.
3 Oxygen molecules will only move across the alveolus wall from the inside to the outside of an alveolus.
(surface area of a sphere = ; volume of a sphere = , where r is the radius)
The diagram shows a model of the effect of emphysema on spherical alveoli.
- 4 healthy alveoli are shown as a cluster of four spheres, with the radius of each alveolus = x.
- 1 alveolus from a person with emphysema is shown as a single larger sphere, with a radius of alveolus = 2x.
Which of the following statements is/are correct?
1 The surface area-to-volume ratio of the four healthy alveoli is twice that of the single emphysema alveolus.
2 For the same concentration gradient, the rate of diffusion of oxygen into the blood from a single healthy alveolus will be greater than for a single emphysema alveolus.
3 Oxygen molecules will only move across the alveolus wall from the inside to the outside of an alveolus.
(surface area of a sphere = ; volume of a sphere = , where r is the radius)
- A.none of them
- B.1 only
- C.2 only
- D.3 only
- E.1 and 2 only
- F.1 and 3 only
- G.2 and 3 only
- H.1, 2 and 3
Answer: D
Question 50
1 markExperiments were carried out to investigate the rate at which products were formed by two digestive enzymes, P and Q over a period of 30 minutes.
P and Q have similar optimum conditions for function. Only the enzyme and its substrate were changed between each reaction.
The results are shown in the graphs.
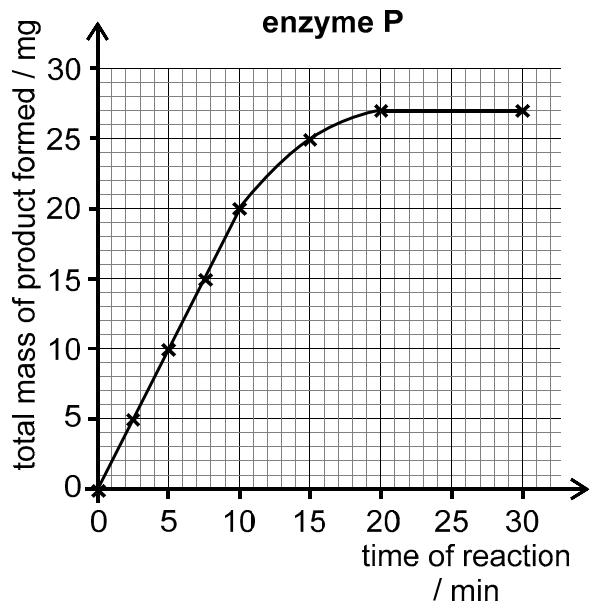
Graph for enzyme P: 'total mass of product formed / mg' (y-axis, 0-30) vs 'time of reaction / min' (x-axis, 0-30). The curve starts at (0,0), rises steeply, then levels off to a plateau at about 25 mg from 20 minutes onwards.
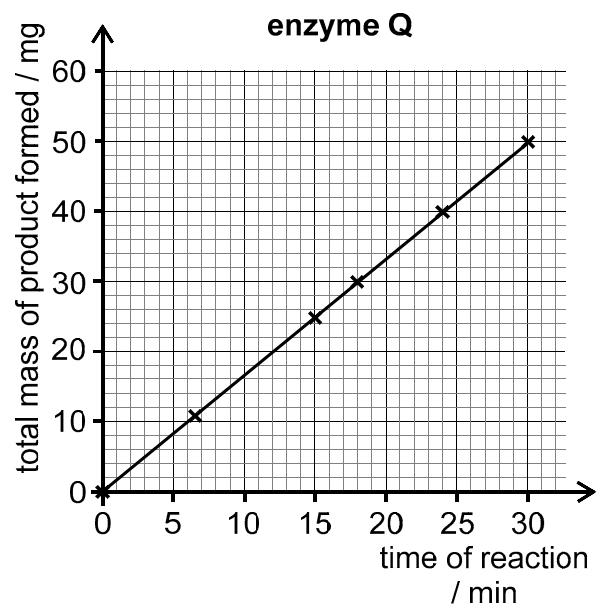
Graph for enzyme Q: 'total mass of product formed / mg' (y-axis, 0-60) vs 'time of reaction / min' (x-axis, 0-30). The graph is a straight line with a positive gradient starting from (0,0) and going up to (30, 50).
Which of the following statements is/are correct?
1 During the first 10 minutes, the rate of reaction () with enzyme P is double the rate with enzyme Q.
2 A possible explanation for the difference in the shape between the graphs is that the product of the reaction catalysed by P significantly alters the pH of the solution.
3 The percentage change in mass of product formed by enzyme Q is more than 5 times greater between 6.5 and 15 minutes than it is between 24 and 29 minutes.
P and Q have similar optimum conditions for function. Only the enzyme and its substrate were changed between each reaction.
The results are shown in the graphs.
Graph for enzyme P: 'total mass of product formed / mg' (y-axis, 0-30) vs 'time of reaction / min' (x-axis, 0-30). The curve starts at (0,0), rises steeply, then levels off to a plateau at about 25 mg from 20 minutes onwards.
Graph for enzyme Q: 'total mass of product formed / mg' (y-axis, 0-60) vs 'time of reaction / min' (x-axis, 0-30). The graph is a straight line with a positive gradient starting from (0,0) and going up to (30, 50).
Which of the following statements is/are correct?
1 During the first 10 minutes, the rate of reaction () with enzyme P is double the rate with enzyme Q.
2 A possible explanation for the difference in the shape between the graphs is that the product of the reaction catalysed by P significantly alters the pH of the solution.
3 The percentage change in mass of product formed by enzyme Q is more than 5 times greater between 6.5 and 15 minutes than it is between 24 and 29 minutes.
- A.none of them
- B.1 only
- C.2 only
- D.3 only
- E.1 and 2 only
- F.1 and 3 only
- G.2 and 3 only
- H.1, 2 and 3
Answer: G
Question 51
1 markAn experiment was performed to investigate whether capillary action could account for the movement of water from roots to leaves in a plant.
The diagram shows apparatus used to model this effect using narrow glass capillary tubing. The inner diameter of the capillary tubing is 0.5 mm. The tubing is placed vertically in a beaker of water, and water rises in the capillary tubing.
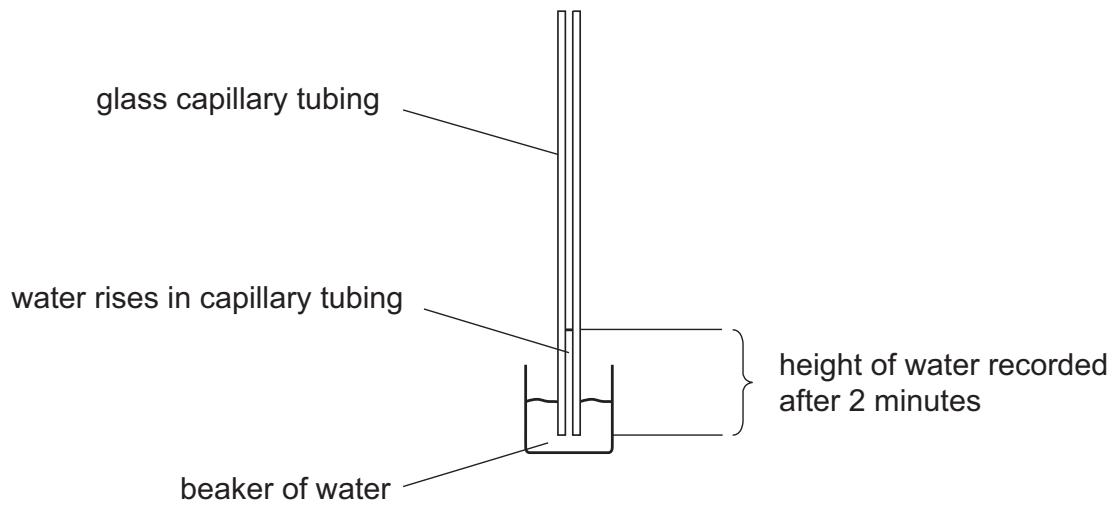
The initial height of the water in the tubing was recorded as 0.2 cm. After 2 minutes the height was recorded as 1.8 cm.
The model assumes the rate of movement is constant.
What is the rate of water movement in and what vessel type transfers water from roots to leaves in a real plant?
The diagram shows apparatus used to model this effect using narrow glass capillary tubing. The inner diameter of the capillary tubing is 0.5 mm. The tubing is placed vertically in a beaker of water, and water rises in the capillary tubing.
The initial height of the water in the tubing was recorded as 0.2 cm. After 2 minutes the height was recorded as 1.8 cm.
The model assumes the rate of movement is constant.
What is the rate of water movement in and what vessel type transfers water from roots to leaves in a real plant?
- A.rate of water movement / : , vessel type: xylem
- B.rate of water movement / : , vessel type: phloem
- C.rate of water movement / : , vessel type: xylem
- D.rate of water movement / : , vessel type: phloem
- E.rate of water movement / : , vessel type: xylem
- F.rate of water movement / : , vessel type: phloem
- G.rate of water movement / : , vessel type: xylem
- H.rate of water movement / : , vessel type: phloem
Answer: A
Question 52
1 markTwo healthy human cells with no mutations were modelled as shown in the diagrams below. The cells were not dividing. Both cells contain a single nucleus and are diploid.
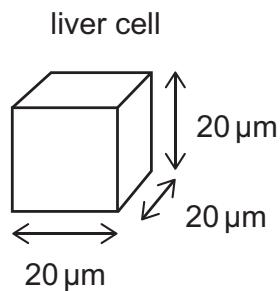
- liver cell: a cube with side length 20 .
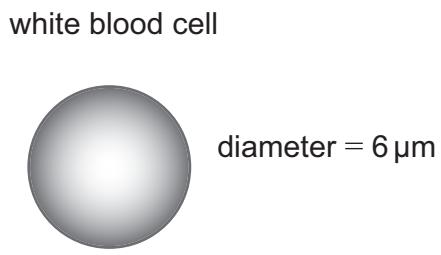
- white blood cell: a sphere with diameter = 6 .
[diagram not to scale]
A study estimates that mitochondria account for 12% of the volume of both types of cells.
Using this estimate for all cells, which of the following is/are correct?
(The volume of a sphere is given by , where r is the radius. Use the value 3.14 for )
1 The larger number of mitochondria in the liver cell will produce more lactic acid than those in the white blood cell.
2 The liver cell is larger and so will contain a greater mass of nuclear DNA than the white blood cell.
3 The mitochondria in the white blood cell occupy 14 to the nearest whole number.
- liver cell: a cube with side length 20 .
- white blood cell: a sphere with diameter = 6 .
[diagram not to scale]
A study estimates that mitochondria account for 12% of the volume of both types of cells.
Using this estimate for all cells, which of the following is/are correct?
(The volume of a sphere is given by , where r is the radius. Use the value 3.14 for )
1 The larger number of mitochondria in the liver cell will produce more lactic acid than those in the white blood cell.
2 The liver cell is larger and so will contain a greater mass of nuclear DNA than the white blood cell.
3 The mitochondria in the white blood cell occupy 14 to the nearest whole number.
- A.none of them
- B.1 only
- C.2 only
- D.3 only
- E.1 and 2 only
- F.1 and 3 only
- G.2 and 3 only
- H.1, 2 and 3
Answer: D
Question 53
1 markBacterial cells were grown in a laboratory experiment and the number of cells was recorded at regular intervals. The bacteria in this experiment reproduced asexually using a form of cell division. The growth medium was sterilised before it was used and the vessel containing the bacterial cells was sealed so that no other cells could enter.
The graph shows the results of the experiment.
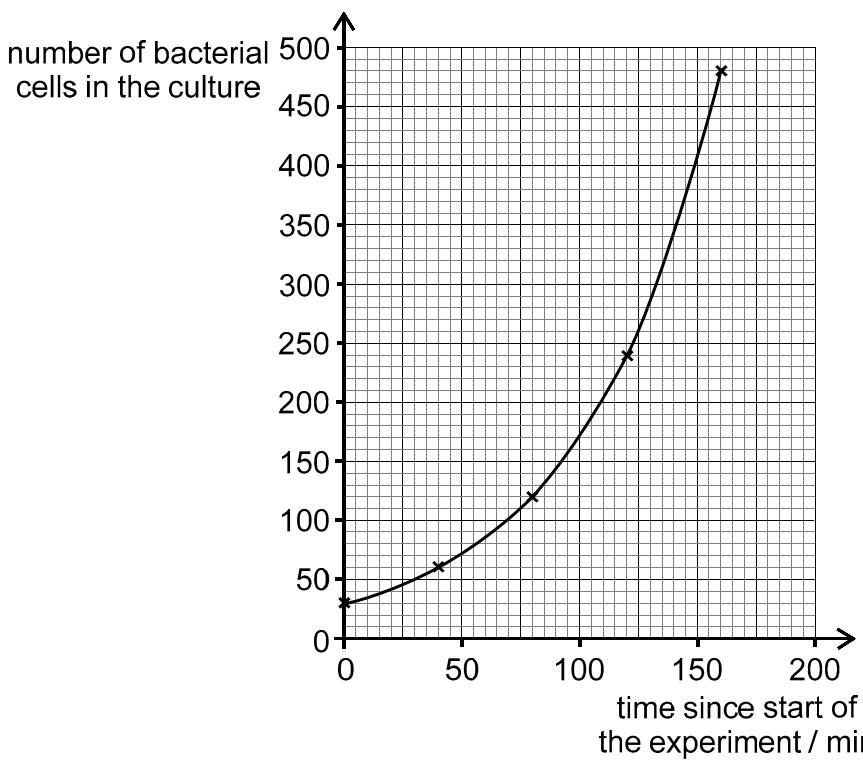
The y-axis is 'number of bacterial cells in the culture' from 0 to 500. The x-axis is 'time since start of the experiment / min' from 0 to 200. The graph shows an exponential growth curve starting near (0, 30) and passing through points approximately (50, 60), (100, 120), (150, 250), and ending near (175, 475).
Which of the following statements is/are correct?
1 After 4 hours, assuming that the rate of growth continues on the same curve, the predicted number of cells in the experiment is 1920.
2 During the 80 minutes after the start of the experiment there was a 400% increase in the number of cells.
3 The growth curve is of the form
The graph shows the results of the experiment.
The y-axis is 'number of bacterial cells in the culture' from 0 to 500. The x-axis is 'time since start of the experiment / min' from 0 to 200. The graph shows an exponential growth curve starting near (0, 30) and passing through points approximately (50, 60), (100, 120), (150, 250), and ending near (175, 475).
Which of the following statements is/are correct?
1 After 4 hours, assuming that the rate of growth continues on the same curve, the predicted number of cells in the experiment is 1920.
2 During the 80 minutes after the start of the experiment there was a 400% increase in the number of cells.
3 The growth curve is of the form
- A.none of them
- B.1 only
- C.2 only
- D.3 only
- E.1 and 2 only
- F.1 and 3 only
- G.2 and 3 only
- H.1, 2 and 3
Answer: B
Question 54
1 markThree samples of cells were taken from the same healthy human: one sample from the blood, one sample from a kidney, and one sample from a testis.
Each sample contained five cells, three of one type and two of a different type. None of the cells were dividing.
In each sample, the mean number of chromosomes per cell was calculated. The results are shown in the table.
| sample | mean number of chromosomes per cell |
|---|---|
| 1 | 18.4 |
| 2 | 32.2 |
| 3 | 46.0 |
Which row in the following table identifies the samples from the kidney and the testis?
(Assume that no mutations occur in any of the cells in the samples.)
Each sample contained five cells, three of one type and two of a different type. None of the cells were dividing.
In each sample, the mean number of chromosomes per cell was calculated. The results are shown in the table.
| sample | mean number of chromosomes per cell |
|---|---|
| 1 | 18.4 |
| 2 | 32.2 |
| 3 | 46.0 |
Which row in the following table identifies the samples from the kidney and the testis?
(Assume that no mutations occur in any of the cells in the samples.)
- A.kidney: 1, testis: 2
- B.kidney: 1, testis: 3
- C.kidney: 2, testis: 1
- D.kidney: 2, testis: 3
- E.kidney: 3, testis: 1
- F.kidney: 3, testis: 2
Answer: F
Question 55
1 markThe graph shows the mean mass of DNA of a population of cells dividing at the same time, measured in femtograms ( g) per cell.
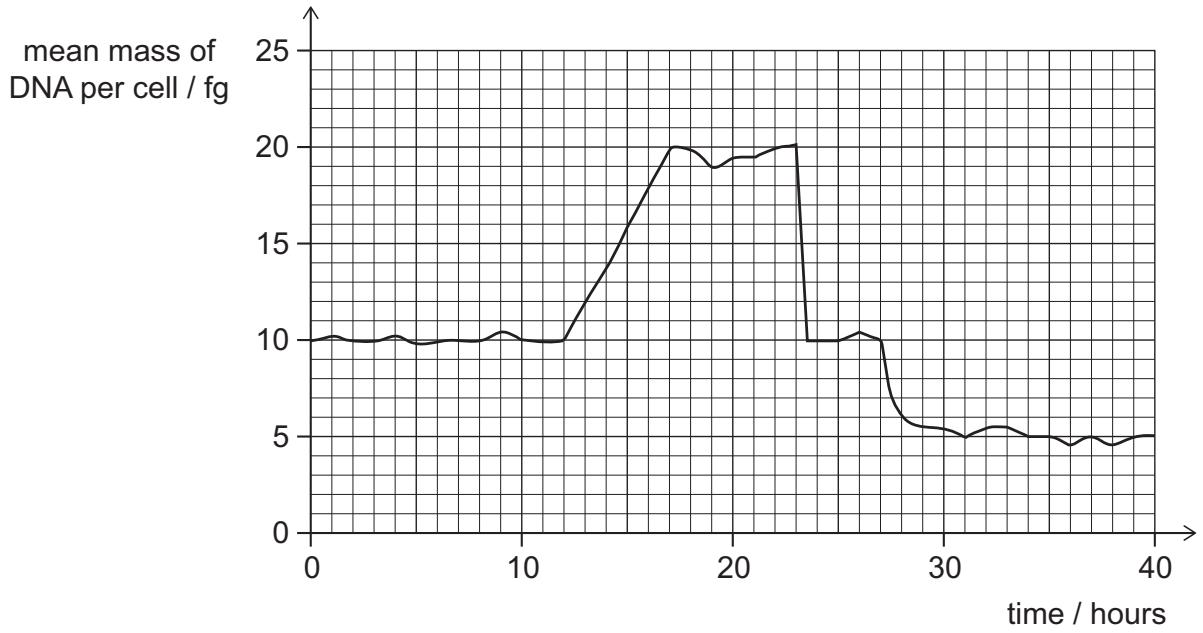
The graph shows 'mean mass of DNA per cell / fg' on the y-axis (0 to 25) and 'time / hours' on the x-axis (0 to 40). The mass starts at 11 fg, remains constant until about 12 hours, then increases linearly to 22 fg at 17 hours. It stays at 22 fg until about 24 hours, then drops to 11 fg. It stays at 11 fg until about 27 hours, then drops to about 5.5 fg. It remains at 5.5 fg until the end of the graph at 40 hours.
Which row in the table is correct?
The graph shows 'mean mass of DNA per cell / fg' on the y-axis (0 to 25) and 'time / hours' on the x-axis (0 to 40). The mass starts at 11 fg, remains constant until about 12 hours, then increases linearly to 22 fg at 17 hours. It stays at 22 fg until about 24 hours, then drops to 11 fg. It stays at 11 fg until about 27 hours, then drops to about 5.5 fg. It remains at 5.5 fg until the end of the graph at 40 hours.
Which row in the table is correct?
- A.type of cell division taking place: meiosis, rate of DNA synthesis per cell between 12 and 17 hours / : 2, period that could be part of interphase: 0 to 17 hours
- B.type of cell division taking place: meiosis, rate of DNA synthesis per cell between 12 and 17 hours / : 0.5, period that could be part of interphase: 0 to 17 hours
- C.type of cell division taking place: meiosis, rate of DNA synthesis per cell between 12 and 17 hours / : 2, period that could be part of interphase: 12 to 24 hours
- D.type of cell division taking place: meiosis, rate of DNA synthesis per cell between 12 and 17 hours / : 0.5, period that could be part of interphase: 12 to 24 hours
- E.type of cell division taking place: mitosis, rate of DNA synthesis per cell between 12 and 17 hours / : 2, period that could be part of interphase: 0 to 17 hours
- F.type of cell division taking place: mitosis, rate of DNA synthesis per cell between 12 and 17 hours / : 0.5, period that could be part of interphase: 0 to 17 hours
- G.type of cell division taking place: mitosis, rate of DNA synthesis per cell between 12 and 17 hours / : 2, period that could be part of interphase: 12 to 24 hours
- H.type of cell division taking place: mitosis, rate of DNA synthesis per cell between 12 and 17 hours / : 0.5, period that could be part of interphase: 12 to 24 hours
Answer: D
Question 56
1 markA plasmid contains genes Q and R. Gene Q codes for resistance to the antibiotic q. Gene R codes for resistance to antibiotic r.
The plasmid was genetically engineered to contain the human gene P. This gene was inserted into gene Q in the plasmid preventing gene Q from working.
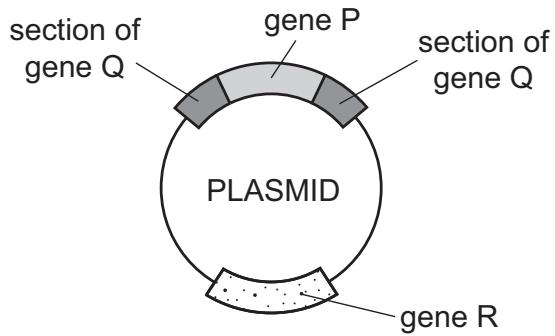
A diagram shows the plasmid with gene R, and gene P inserted into the middle of gene Q.
A mixture of the original plasmid and the genetically-engineered plasmid were available to be taken up by bacterial cells. The bacterial cells took up either the original plasmid, or the genetically-engineered plasmid, or neither of the plasmids.
All these bacteria were allowed to grow and form colonies on agar plates in the absence of both antibiotics.
40 colonies formed.
Cells from each of the 40 colonies were grown on three agar plates with different contents.
The table shows the number of colonies that grew on each of the three plates.
| contents of agar plate | number of bacterial colonies able to survive on the agar plate |
|---|---|
| no antibiotic | 40 |
| antibiotic q only | 8 |
| antibiotic r only | 24 |
What percentage of the original 40 bacteria now contain gene P?
(Assume that no mutations occur.)
The plasmid was genetically engineered to contain the human gene P. This gene was inserted into gene Q in the plasmid preventing gene Q from working.
A diagram shows the plasmid with gene R, and gene P inserted into the middle of gene Q.
A mixture of the original plasmid and the genetically-engineered plasmid were available to be taken up by bacterial cells. The bacterial cells took up either the original plasmid, or the genetically-engineered plasmid, or neither of the plasmids.
All these bacteria were allowed to grow and form colonies on agar plates in the absence of both antibiotics.
40 colonies formed.
Cells from each of the 40 colonies were grown on three agar plates with different contents.
The table shows the number of colonies that grew on each of the three plates.
| contents of agar plate | number of bacterial colonies able to survive on the agar plate |
|---|---|
| no antibiotic | 40 |
| antibiotic q only | 8 |
| antibiotic r only | 24 |
What percentage of the original 40 bacteria now contain gene P?
(Assume that no mutations occur.)
- A.16%
- B.20%
- C.33%
- D.40%
- E.60%
- F.80%
Answer: A