Mapped to the ESAT specification
NSAA 2021 Biology Part Z
20 questions20 marksUpdated June 2026
Natural Sciences Admissions Assessment 2021 is one of the closest available past papers for the Engineering and Science Admissions Test. Below, all 20 questions are mapped to the ESAT topics they test, each with its answer. Sit it cold under exam timing, then work back through anything you missed using the solutions.
What this paper covers on the ESAT
Every question mapped to the Engineering and Science Admissions Test specification, so you know exactly which areas it tests.
Mathematics 1
- Algebra (4)
- Geometry (1)
- Ratio and proportion (1)
Chemistry
- Acids, bases and salts (1)
- Quantitative chemistry (1)
Biology
- Animal physiology (11)
- Cell division and sex determination (5)
- Inheritance (5)
- Cells (4)
- DNA (4)
- Movement across membranes (4)
- Ecosystems (3)
- Variation (3)
- Gene technologies (2)
- Plant physiology (2)
Questions and answers are free. Full step-by-step worked solutions unlock with a free account. Start practising.
Question 41
1 markCystic fibrosis and sickle cell anaemia are both recessive genetic conditions and the genes for these conditions are found on different non-sex chromosomes.
The following statements are true for one set of parents who have only one child:
• Both parents are heterozygous for cystic fibrosis.
• One parent is homozygous recessive for sickle cell anaemia.
• One parent is heterozygous for sickle cell anaemia.
What is the probability of this child having both conditions?
The following statements are true for one set of parents who have only one child:
• Both parents are heterozygous for cystic fibrosis.
• One parent is homozygous recessive for sickle cell anaemia.
• One parent is heterozygous for sickle cell anaemia.
What is the probability of this child having both conditions?
- A.0.75
- B.0.5
- C.0.375
- D.0.25
- E.0.125
- F.0.0625
Answer: E
Question 42
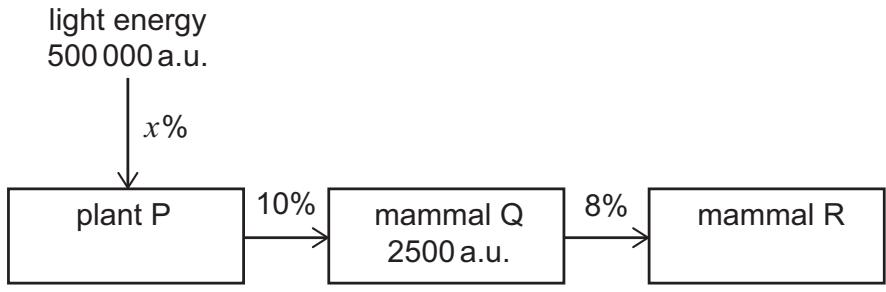
1 markThe diagram shows a food chain. The numbers represent energy available and are in arbitrary units (a.u.), and the percentages represent efficiency of energy transfer.
light energy
500 000 a.u.
↓ x%
plant P → 10% → mammal Q (2500 a.u.) → 8% → mammal R
The energy transfer between trophic levels is not 100% efficient.
Which row is correct for this food chain?
(Table provided in options)
light energy
500 000 a.u.
↓ x%
plant P → 10% → mammal Q (2500 a.u.) → 8% → mammal R
The energy transfer between trophic levels is not 100% efficient.
Which row is correct for this food chain?
(Table provided in options)
- A.efficiency of energy transfer x: 1%, a reason for inefficiency of energy transfer from Q to R: energy lost as heat
- B.efficiency of energy transfer x: 1%, a reason for inefficiency of energy transfer from Q to R: cellulose not digested
- C.efficiency of energy transfer x: 1%, a reason for inefficiency of energy transfer from Q to R: some wavelengths of light not used
- D.efficiency of energy transfer x: 5%, a reason for inefficiency of energy transfer from Q to R: energy lost as heat
- E.efficiency of energy transfer x: 5%, a reason for inefficiency of energy transfer from Q to R: cellulose not digested
- F.efficiency of energy transfer x: 5%, a reason for inefficiency of energy transfer from Q to R: some wavelengths of light not used
Answer: D
Question 43
1 markA number of patients in a hospital were infected with the same bacterial pathogen. The symptoms of this infection included pain in the abdomen, sickness and loss of appetite partly resulting from decreased production of acid in the stomach.
The bacteria present in their digestive systems were compared with those of healthy volunteers.
Samples were taken from each person and examined in order to identify the type of bacteria present and their relative proportions.
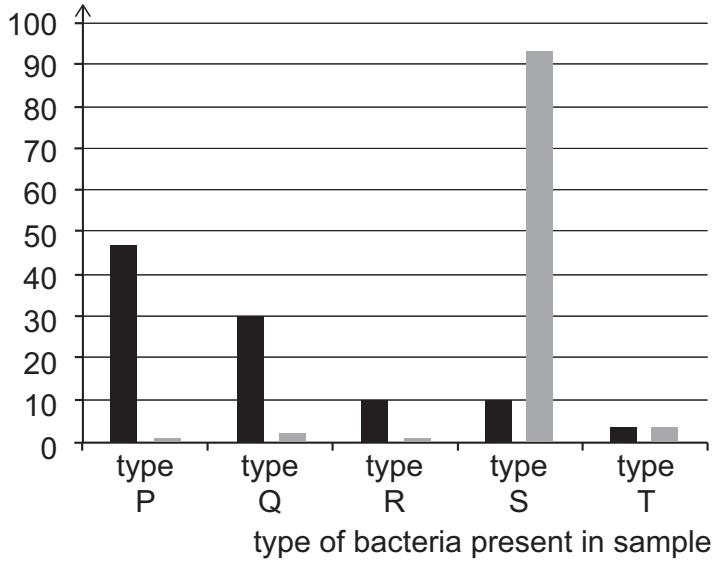
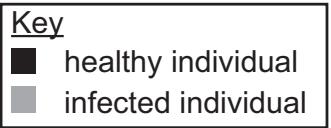
The results of the study are shown in the chart. The chart shows the percentage of bacteria in samples for five types of bacteria (P, Q, R, S, T). The key indicates bars for 'healthy individual' (dark grey) and 'infected individual' (light grey).
For healthy individuals: P is ~55%, Q is ~35%, R is ~20%, S is ~20%, T is ~5%.
For infected individuals: P, Q, R are almost 0%, S is ~95%, T is ~8%.
Which of the following statements could be correct?
1 Type S and type T feed on different biological molecules.
2 The DNA sequence of bacterial genes was used to classify the bacteria.
3 Type P, type Q and type R reduce in number because they require an alkaline environment.
The bacteria present in their digestive systems were compared with those of healthy volunteers.
Samples were taken from each person and examined in order to identify the type of bacteria present and their relative proportions.
The results of the study are shown in the chart. The chart shows the percentage of bacteria in samples for five types of bacteria (P, Q, R, S, T). The key indicates bars for 'healthy individual' (dark grey) and 'infected individual' (light grey).
For healthy individuals: P is ~55%, Q is ~35%, R is ~20%, S is ~20%, T is ~5%.
For infected individuals: P, Q, R are almost 0%, S is ~95%, T is ~8%.
Which of the following statements could be correct?
1 Type S and type T feed on different biological molecules.
2 The DNA sequence of bacterial genes was used to classify the bacteria.
3 Type P, type Q and type R reduce in number because they require an alkaline environment.
- A.none of them
- B.1 only
- C.2 only
- D.3 only
- E.1 and 2 only
- F.1 and 3 only
- G.2 and 3 only
- H.1, 2 and 3
Answer: E
Question 44
1 markA scientist studied one species of plant and grew some at 20 °C (plants P) and some at 30 °C (plants Q). All other variables were kept constant.
The scientist then placed plants from each group into six separate temperature-controlled cabinets, each at a different temperature. The plants were left for 15 minutes to adjust to their new temperature. The scientist then measured the rate of net carbon dioxide uptake by the leaves on the plants. All other variables were kept constant.
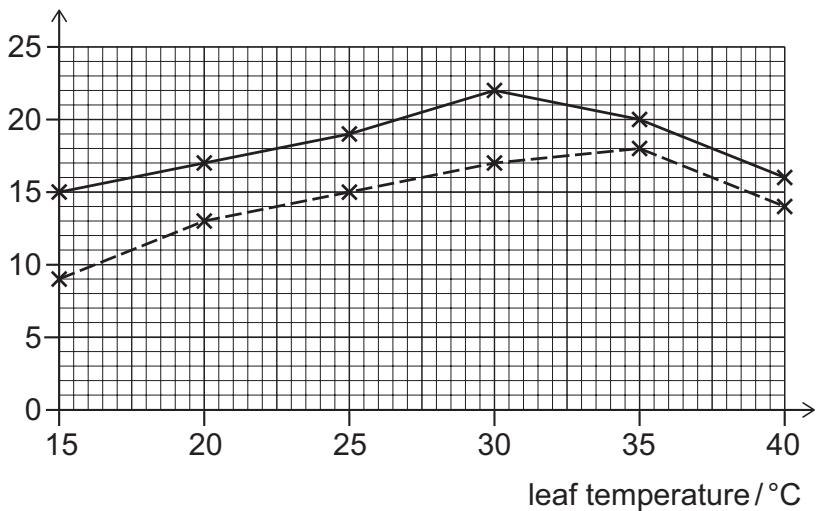
The results are shown in the graph. The graph shows 'net carbon dioxide uptake / ' on the y-axis versus 'leaf temperature/°C' on the x-axis. The key shows a solid line for plants P (grown at 20 °C) and a dashed line for plants Q (grown at 30 °C). Plant P's uptake peaks at around 22 at 30°C. Plant Q's uptake peaks at around 20 at 35°C.
Which of the following statements is/are correct?
1 At 35°C, a 200 cm² leaf of plant P would take up of carbon dioxide in one hour.
2 Assuming that their respiration rates are the same, the rate of oxygen production in a leaf from plant P at 20 °C will be approximately equal to that in a leaf of the same size from plant Q at 30°C.
3 The optimum temperature for maximum rate of photosynthesis in plant P must be 30°C.
The scientist then placed plants from each group into six separate temperature-controlled cabinets, each at a different temperature. The plants were left for 15 minutes to adjust to their new temperature. The scientist then measured the rate of net carbon dioxide uptake by the leaves on the plants. All other variables were kept constant.
The results are shown in the graph. The graph shows 'net carbon dioxide uptake / ' on the y-axis versus 'leaf temperature/°C' on the x-axis. The key shows a solid line for plants P (grown at 20 °C) and a dashed line for plants Q (grown at 30 °C). Plant P's uptake peaks at around 22 at 30°C. Plant Q's uptake peaks at around 20 at 35°C.
Which of the following statements is/are correct?
1 At 35°C, a 200 cm² leaf of plant P would take up of carbon dioxide in one hour.
2 Assuming that their respiration rates are the same, the rate of oxygen production in a leaf from plant P at 20 °C will be approximately equal to that in a leaf of the same size from plant Q at 30°C.
3 The optimum temperature for maximum rate of photosynthesis in plant P must be 30°C.
- A.none of them
- B.1 only
- C.2 only
- D.3 only
- E.1 and 2 only
- F.1 and 3 only
- G.2 and 3 only
- H.1, 2 and 3
Answer: C
Question 45
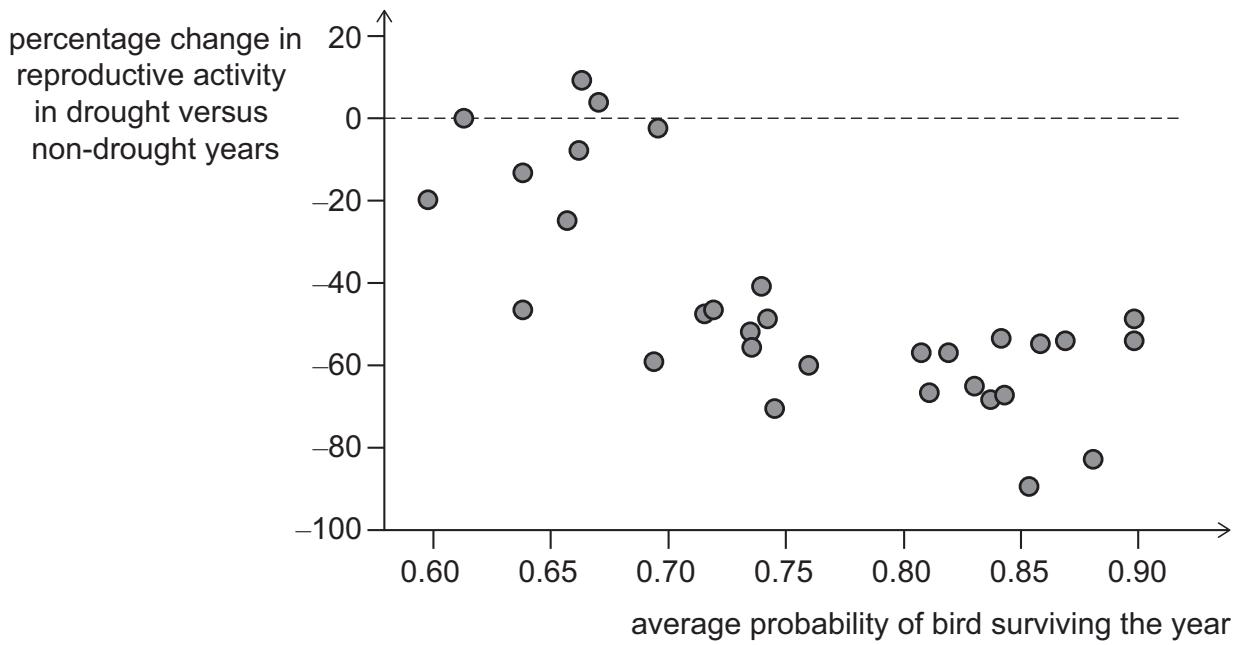
1 markA group of scientists studied the effect of droughts on the reproduction rate and lifespan of different species of birds.
The graph shows their results. Each data point refers to a different species.
The graph is a scatter plot with 'average probability of bird surviving the year' on the x-axis (from 0.60 to 0.90) and 'percentage change in reproductive activity in drought versus non-drought years' on the y-axis (from -100 to 20). The data points generally show a downward trend, from around -20% change at 0.60 survival to around -50% change at 0.90 survival. There are a few points above the 0% line.
Which of these statements is/are correct?
1 The overall trend for this data shows that birds with shorter life expectancies tended to change their reproduction rates less in drought years.
2 Some birds were found to reproduce more in drought years than in non-drought years.
3 These birds were being studied for the effect of a biotic factor on their population size.
The graph shows their results. Each data point refers to a different species.
The graph is a scatter plot with 'average probability of bird surviving the year' on the x-axis (from 0.60 to 0.90) and 'percentage change in reproductive activity in drought versus non-drought years' on the y-axis (from -100 to 20). The data points generally show a downward trend, from around -20% change at 0.60 survival to around -50% change at 0.90 survival. There are a few points above the 0% line.
Which of these statements is/are correct?
1 The overall trend for this data shows that birds with shorter life expectancies tended to change their reproduction rates less in drought years.
2 Some birds were found to reproduce more in drought years than in non-drought years.
3 These birds were being studied for the effect of a biotic factor on their population size.
- A.none of them
- B.1 only
- C.2 only
- D.3 only
- E.1 and 2 only
- F.1 and 3 only
- G.2 and 3 only
- H.1, 2 and 3
Answer: E
Question 46
1 markThe average volume of a mammalian mitochondrion is 0.5 . The density of the enzymes within the mitochondria is 450 mg of enzymes per mm³ of mitochondrial volume.
What is the mass, in mg, of enzyme inside an average mammalian mitochondrion, and how would a decrease in enzyme density within all mitochondria inside a cell change the rate of anaerobic respiration in the cell as a whole?
(Assume that the overall metabolic rate of the cell remains constant.)
What is the mass, in mg, of enzyme inside an average mammalian mitochondrion, and how would a decrease in enzyme density within all mitochondria inside a cell change the rate of anaerobic respiration in the cell as a whole?
(Assume that the overall metabolic rate of the cell remains constant.)
- A.mass of enzyme inside an average mammalian mitochondrion / mg: , change in the rate of anaerobic respiration in the cell as a whole that may occur if the enzyme density decreases: decreases
- B.mass of enzyme inside an average mammalian mitochondrion / mg: , change in the rate of anaerobic respiration in the cell as a whole that may occur if the enzyme density decreases: increases
- C.mass of enzyme inside an average mammalian mitochondrion / mg: , change in the rate of anaerobic respiration in the cell as a whole that may occur if the enzyme density decreases: decreases
- D.mass of enzyme inside an average mammalian mitochondrion / mg: , change in the rate of anaerobic respiration in the cell as a whole that may occur if the enzyme density decreases: increases
- E.mass of enzyme inside an average mammalian mitochondrion / mg: , change in the rate of anaerobic respiration in the cell as a whole that may occur if the enzyme density decreases: decreases
- F.mass of enzyme inside an average mammalian mitochondrion / mg: , change in the rate of anaerobic respiration in the cell as a whole that may occur if the enzyme density decreases: increases
- G.mass of enzyme inside an average mammalian mitochondrion / mg: , change in the rate of anaerobic respiration in the cell as a whole that may occur if the enzyme density decreases: decreases
- H.mass of enzyme inside an average mammalian mitochondrion / mg: , change in the rate of anaerobic respiration in the cell as a whole that may occur if the enzyme density decreases: increases
Answer: B
Question 47
1 markAt a certain time, the percentage of oxygen carried in the blood entering the right atrium is 40% of its maximum capacity.
At this time, a section of a human pulmonary artery is 5 cm long and has a lumen diameter of 2.8 mm.
Another artery in the human body is the renal artery.
What is the volume of blood in this pulmonary artery section, and the oxygen level in the blood in the renal artery, at this time?
At this time, a section of a human pulmonary artery is 5 cm long and has a lumen diameter of 2.8 mm.
Another artery in the human body is the renal artery.
What is the volume of blood in this pulmonary artery section, and the oxygen level in the blood in the renal artery, at this time?
- A.volume of blood in the lumen of this pulmonary artery section / : , percentage of oxygen carried in the blood in the renal artery: less than 40%
- B.volume of blood in the lumen of this pulmonary artery section / : , percentage of oxygen carried in the blood in the renal artery: less than 40%
- C.volume of blood in the lumen of this pulmonary artery section / : , percentage of oxygen carried in the blood in the renal artery: less than 40%
- D.volume of blood in the lumen of this pulmonary artery section / : , percentage of oxygen carried in the blood in the renal artery: 40%
- E.volume of blood in the lumen of this pulmonary artery section / : , percentage of oxygen carried in the blood in the renal artery: 40%
- F.volume of blood in the lumen of this pulmonary artery section / : , percentage of oxygen carried in the blood in the renal artery: greater than 40%
- G.volume of blood in the lumen of this pulmonary artery section / : , percentage of oxygen carried in the blood in the renal artery: greater than 40%
- H.volume of blood in the lumen of this pulmonary artery section / : , percentage of oxygen carried in the blood in the renal artery: greater than 40%
Answer: G
Question 48
1 markA 1 cm³ sample of blood was taken from an infected patient. This sample was added to saline solution to make a total volume of 50 cm³.
This diluted sample was then viewed using a haemocytometer, a special microscope slide that allows the number of blood cells in a known volume to be counted. The volume analysed using the haemocytometer was cm³.
The type and number of cells counted is shown.
| cell type | number of cells |
|-----------------------|-----------------|
| mature red blood cell | 12 |
| white blood cell | 4 |
| bacterial cell | 5 |
Using this data only, how many cells with nuclei were present in the 1 cm³ sample from the patient?
This diluted sample was then viewed using a haemocytometer, a special microscope slide that allows the number of blood cells in a known volume to be counted. The volume analysed using the haemocytometer was cm³.
The type and number of cells counted is shown.
| cell type | number of cells |
|-----------------------|-----------------|
| mature red blood cell | 12 |
| white blood cell | 4 |
| bacterial cell | 5 |
Using this data only, how many cells with nuclei were present in the 1 cm³ sample from the patient?
- A.
- B.
- C.
- D.
- E.
- F.
- G.
- H.
Answer: D
Question 49
1 markThe oxygen saturation of red blood cells is the percentage of haemoglobin binding sites in red blood cells with oxygen bound to them.
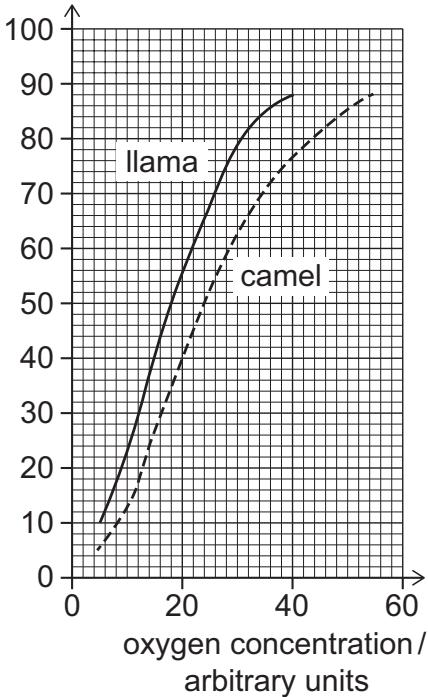
Camels and llamas have evolved from the same ancestor. Camels live at low altitude and llamas live at high altitude.
The graph shows the effect of oxygen concentration on the oxygen saturation of red blood cells in camels and llamas.
The graph shows 'percentage of binding sites in red blood cells with oxygen bound' on the y-axis (0-100) and 'oxygen concentration/arbitrary units' on the x-axis (0-60). Two sigmoidal curves are shown. The llama curve is to the left of the camel curve, indicating a higher affinity for oxygen at any given concentration.
Which of the following statements is/are correct?
1 The difference in oxygen binding properties of the red blood cells of camels and llamas is an example of different phenotypes.
2 The different oxygen binding properties evolved because of mutations caused by different oxygen concentrations.
3 50% oxygen saturation of llama red blood cells occurs at of the oxygen concentration required for 50% oxygen saturation of camel red blood cells.
Camels and llamas have evolved from the same ancestor. Camels live at low altitude and llamas live at high altitude.
The graph shows the effect of oxygen concentration on the oxygen saturation of red blood cells in camels and llamas.
The graph shows 'percentage of binding sites in red blood cells with oxygen bound' on the y-axis (0-100) and 'oxygen concentration/arbitrary units' on the x-axis (0-60). Two sigmoidal curves are shown. The llama curve is to the left of the camel curve, indicating a higher affinity for oxygen at any given concentration.
Which of the following statements is/are correct?
1 The difference in oxygen binding properties of the red blood cells of camels and llamas is an example of different phenotypes.
2 The different oxygen binding properties evolved because of mutations caused by different oxygen concentrations.
3 50% oxygen saturation of llama red blood cells occurs at of the oxygen concentration required for 50% oxygen saturation of camel red blood cells.
- A.none of them
- B.1 only
- C.2 only
- D.3 only
- E.1 and 2 only
- F.1 and 3 only
- G.2 and 3 only
- H.1, 2 and 3
Answer: C
Question 50
1 markWater in a particular plant moves from a high water potential to a low (more negative) water potential. Water potential is measured in MPa.
Which row correctly describes the most direct pathway for water movement into, through, and out of this plant?
Which row correctly describes the most direct pathway for water movement into, through, and out of this plant?
- A.water potential in soil / MPa: -75, water potential in plant root / MPa: -1.5, tissue in plant for water transport: xylem, water potential in leaf / MPa: -0.1, water potential in atmosphere / MPa: -0.033, a mechanism for water leaving the leaf: diffusion
- B.water potential in soil / MPa: -0.033, water potential in plant root / MPa: -0.1, tissue in plant for water transport: xylem, water potential in leaf / MPa: -1.5, water potential in atmosphere / MPa: -75, a mechanism for water leaving the leaf: diffusion
- C.water potential in soil / MPa: -0.033, water potential in plant root / MPa: -0.1, tissue in plant for water transport: phloem, water potential in leaf / MPa: -1.5, water potential in atmosphere / MPa: -75, a mechanism for water leaving the leaf: diffusion
- D.water potential in soil / MPa: -75, water potential in plant root / MPa: -1.5, tissue in plant for water transport: phloem, water potential in leaf / MPa: -0.1, water potential in atmosphere / MPa: -0.033, a mechanism for water leaving the leaf: osmosis
- E.water potential in soil / MPa: -1.5, water potential in plant root / MPa: -75, tissue in plant for water transport: phloem, water potential in leaf / MPa: -0.033, water potential in atmosphere / MPa: -0.1, a mechanism for water leaving the leaf: osmosis
- F.water potential in soil / MPa: -0.033, water potential in plant root / MPa: -0.1, tissue in plant for water transport: xylem, water potential in leaf / MPa: -1.5, water potential in atmosphere / MPa: -75, a mechanism for water leaving the leaf: osmosis
Answer: B
Question 51
1 markOn a cool spring day (day 1), a healthy human produces 1500 cm³ of urine.
The concentration of urea in the urine was measured as 2.00 g per 100 cm³.
On a similar day (day 2), the same person plays a game of hockey and produces 20% less urine. However, the mass of urea excreted in the urine remains the same.
The volume of urine produced is affected by the movement of water in the nephron.
Which row shows the urea concentration in the urine, in g dm⁻³, on day 1 and day 2, and the explanation for the change in urine volume?
The concentration of urea in the urine was measured as 2.00 g per 100 cm³.
On a similar day (day 2), the same person plays a game of hockey and produces 20% less urine. However, the mass of urea excreted in the urine remains the same.
The volume of urine produced is affected by the movement of water in the nephron.
Which row shows the urea concentration in the urine, in g dm⁻³, on day 1 and day 2, and the explanation for the change in urine volume?
- A.urea concentration / g dm⁻³ day 1: 20.0, day 2: 16.7, explanation for change in urine volume - change in ADH (vasopressin): decrease, change in water movement in the nephron: decrease in secretion of water
- B.urea concentration / g dm⁻³ day 1: 20.0, day 2: 16.7, explanation for change in urine volume - change in ADH (vasopressin): increase, change in water movement in the nephron: increase in reabsorption of water
- C.urea concentration / g dm⁻³ day 1: 20.0, day 2: 25.0, explanation for change in urine volume - change in ADH (vasopressin): decrease, change in water movement in the nephron: decrease in secretion of water
- D.urea concentration / g dm⁻³ day 1: 20.0, day 2: 25.0, explanation for change in urine volume - change in ADH (vasopressin): increase, change in water movement in the nephron: increase in reabsorption of water
- E.urea concentration / g dm⁻³ day 1: 30.0, day 2: 25.0, explanation for change in urine volume - change in ADH (vasopressin): decrease, change in water movement in the nephron: decrease in secretion of water
- F.urea concentration / g dm⁻³ day 1: 30.0, day 2: 25.0, explanation for change in urine volume - change in ADH (vasopressin): increase, change in water movement in the nephron: increase in reabsorption of water
- G.urea concentration / g dm⁻³ day 1: 30.0, day 2: 36.0, explanation for change in urine volume - change in ADH (vasopressin): decrease, change in water movement in the nephron: decrease in secretion of water
- H.urea concentration / g dm⁻³ day 1: 30.0, day 2: 36.0, explanation for change in urine volume - change in ADH (vasopressin): increase, change in water movement in the nephron: increase in reabsorption of water
Answer: D
Question 52
1 markA scientist conducts an experiment to study a single-celled organism in a growth tube.
The organism divides once every 50 minutes using binary fission. Binary fission produces the same number of daughter cells per division as a cell dividing by mitosis.
The scientist starts with 150 cells. The experiment is left for 300 minutes.
The average volume of every cell is 5 .
To ensure there are sufficient nutrients available for the cells, the final volume of cells within the tube must not be more than 1% of the total volume of material inside the tube.
What is the minimum volume of nutrient solution required inside the growth tube at the start of the experiment?
(Assume that all the cells are alive and capable of dividing.)
The organism divides once every 50 minutes using binary fission. Binary fission produces the same number of daughter cells per division as a cell dividing by mitosis.
The scientist starts with 150 cells. The experiment is left for 300 minutes.
The average volume of every cell is 5 .
To ensure there are sufficient nutrients available for the cells, the final volume of cells within the tube must not be more than 1% of the total volume of material inside the tube.
What is the minimum volume of nutrient solution required inside the growth tube at the start of the experiment?
(Assume that all the cells are alive and capable of dividing.)
- A.
- B.
- C.
- D.
- E.
- F.
- G.
- H.
Answer: A
Question 53
1 markSex determination in cows is identical to that in humans. To maximise productivity, dairy farmers want their cows to have female calves only.
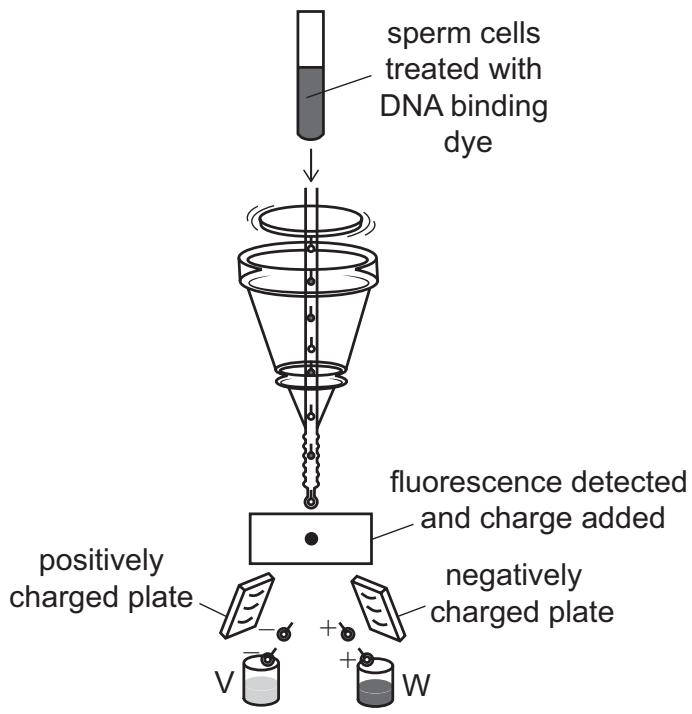
Sperm cells can be sorted using their DNA content. This method is used to ensure the sex of calves born to dairy cows following artificial insemination. The method used is described below:
• The sperm cells are treated with a DNA binding dye.
• The greater the DNA content, the brighter the binding dye fluoresces.
• The brighter sperm cells are given a positive charge and the remaining sperm cells are given a negative charge.
• The charged sperm cells pass through a pair of charged plates and are attracted to the plate with the opposite charge.
• The sperm cells are collected in beakers below the plates.
[Diagram showing sperm cells treated with dye passing through a fluorescence detector. Charged cells are then deflected by charged plates. Negatively charged sperm are deflected towards a positive plate and collected in beaker V. Positively charged sperm are deflected towards a negative plate and collected in beaker W.]
Assume that all the separated sperm cells are alive and capable of fertilisation, no mutations have occurred, and the method of separation is 100% efficient.
Which of the following statements is/are correct?
1 Sperm cells in beaker V have fewer chromosomes.
2 For maximum productivity, dairy farmers should only use positively charged sperm cells.
3 The chance of obtaining a female calf using sperm cells from beaker W will be double that of using unseparated sperm cells.
Sperm cells can be sorted using their DNA content. This method is used to ensure the sex of calves born to dairy cows following artificial insemination. The method used is described below:
• The sperm cells are treated with a DNA binding dye.
• The greater the DNA content, the brighter the binding dye fluoresces.
• The brighter sperm cells are given a positive charge and the remaining sperm cells are given a negative charge.
• The charged sperm cells pass through a pair of charged plates and are attracted to the plate with the opposite charge.
• The sperm cells are collected in beakers below the plates.
[Diagram showing sperm cells treated with dye passing through a fluorescence detector. Charged cells are then deflected by charged plates. Negatively charged sperm are deflected towards a positive plate and collected in beaker V. Positively charged sperm are deflected towards a negative plate and collected in beaker W.]
Assume that all the separated sperm cells are alive and capable of fertilisation, no mutations have occurred, and the method of separation is 100% efficient.
Which of the following statements is/are correct?
1 Sperm cells in beaker V have fewer chromosomes.
2 For maximum productivity, dairy farmers should only use positively charged sperm cells.
3 The chance of obtaining a female calf using sperm cells from beaker W will be double that of using unseparated sperm cells.
- A.none of them
- B.1 only
- C.2 only
- D.3 only
- E.1 and 2 only
- F.1 and 3 only
- G.2 and 3 only
- H.1, 2 and 3
Answer: G
Question 54
1 markIn a sample of four healthy human cells, three rounds of division occur. After the three divisions, there are a total of 1472 chromosomes present in the sample.
The diploid number in human cells is 46.
Which of the following statements about this sample is/are correct?
1 The cells could all be fertilised eggs that divided by mitosis only.
2 The cell divisions could be two rounds of mitosis and then one round of complete meiosis.
3 If a single mutation occurred in one allele just before the second division in one cell, then the final percentage of the cells with this mutation would be 12.5%.
The diploid number in human cells is 46.
Which of the following statements about this sample is/are correct?
1 The cells could all be fertilised eggs that divided by mitosis only.
2 The cell divisions could be two rounds of mitosis and then one round of complete meiosis.
3 If a single mutation occurred in one allele just before the second division in one cell, then the final percentage of the cells with this mutation would be 12.5%.
- A.none of them
- B.1 only
- C.2 only
- D.3 only
- E.1 and 2 only
- F.1 and 3 only
- G.2 and 3 only
- H.1, 2 and 3
Answer: H
Question 55
1 markSamples of solution removed from different positions inside a nephron are analysed.
The rate of flow of the solution through the nephron is measured at each position where the samples are taken.
The rate of flow is the volume of solution passing a particular point per unit time.
In the Bowman's capsule, the concentration of sodium ions is the same as in the blood. The rate of flow is 100 arbitrary units.
At the collecting duct, the concentration of sodium ions is twice that in the blood. The rate of flow is 1 arbitrary unit.
Which row in the table is correct?
The rate of flow of the solution through the nephron is measured at each position where the samples are taken.
The rate of flow is the volume of solution passing a particular point per unit time.
In the Bowman's capsule, the concentration of sodium ions is the same as in the blood. The rate of flow is 100 arbitrary units.
At the collecting duct, the concentration of sodium ions is twice that in the blood. The rate of flow is 1 arbitrary unit.
Which row in the table is correct?
- A.percentage sodium ions reabsorbed in the nephron: 2%, a process by which sodium ions can be reabsorbed from the nephron: active transport
- B.percentage sodium ions reabsorbed in the nephron: 2%, a process by which sodium ions can be reabsorbed from the nephron: diffusion
- C.percentage sodium ions reabsorbed in the nephron: 50%, a process by which sodium ions can be reabsorbed from the nephron: osmosis
- D.percentage sodium ions reabsorbed in the nephron: 50%, a process by which sodium ions can be reabsorbed from the nephron: diffusion
- E.percentage sodium ions reabsorbed in the nephron: 98%, a process by which sodium ions can be reabsorbed from the nephron: active transport
- F.percentage sodium ions reabsorbed in the nephron: 98%, a process by which sodium ions can be reabsorbed from the nephron: osmosis
Answer: E
Question 56
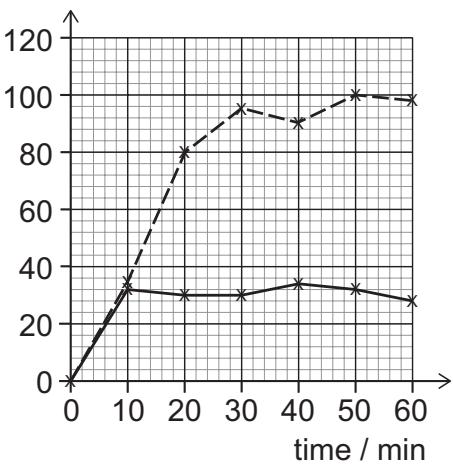
1 markMutations can occur in the genes coding for some of the enzymes that catalyse respiration reactions. This can result in mitochondria that do not function correctly.
Scientists studying this tested a molecule, T, for its ability to restore the function to these mitochondria in human cells.
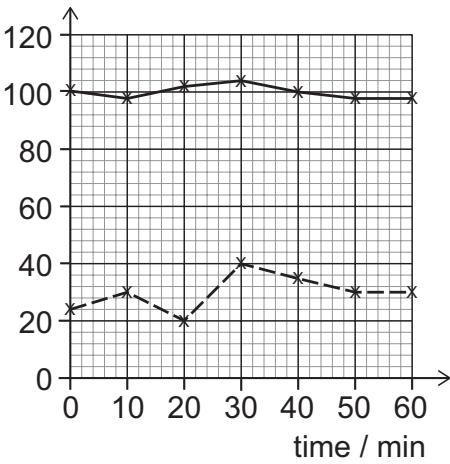
The graphs show the rate of oxygen consumption, measured relative to the percentage of healthy mitochondria, and the rate of acidification of the cellular environment, over time.
Key: solid line = with molecule T, dashed line = without molecule T.
Graph 1 (left): 'relative rate of oxygen consumption' vs 'time / min'. 'With molecule T' line is stable around 100. 'Without molecule T' line starts around 30, increases slightly to ~40 at 30 mins, then decreases back to ~30.
Graph 2 (right): 'rate of acidification / arbitrary units' vs 'time / min'. 'With molecule T' line is stable and low, around 25. 'Without molecule T' line rises from 0 to about 100 by 30 mins, then levels off.
Which of the following statements is/are correct?
1 Molecule T could reduce the rate of lactic acid production in the cells.
2 Between 20 and 30 minutes, the oxygen consumption rate without molecule T increases by 50%.
3 The concentration gradient for oxygen between the cell cytoplasm and the mitochondria is steeper with molecule T compared to without molecule T.
Scientists studying this tested a molecule, T, for its ability to restore the function to these mitochondria in human cells.
The graphs show the rate of oxygen consumption, measured relative to the percentage of healthy mitochondria, and the rate of acidification of the cellular environment, over time.
Key: solid line = with molecule T, dashed line = without molecule T.
Graph 1 (left): 'relative rate of oxygen consumption' vs 'time / min'. 'With molecule T' line is stable around 100. 'Without molecule T' line starts around 30, increases slightly to ~40 at 30 mins, then decreases back to ~30.
Graph 2 (right): 'rate of acidification / arbitrary units' vs 'time / min'. 'With molecule T' line is stable and low, around 25. 'Without molecule T' line rises from 0 to about 100 by 30 mins, then levels off.
Which of the following statements is/are correct?
1 Molecule T could reduce the rate of lactic acid production in the cells.
2 Between 20 and 30 minutes, the oxygen consumption rate without molecule T increases by 50%.
3 The concentration gradient for oxygen between the cell cytoplasm and the mitochondria is steeper with molecule T compared to without molecule T.
- A.none of them
- B.1 only
- C.2 only
- D.3 only
- E.1 and 2 only
- F.1 and 3 only
- G.2 and 3 only
- H.1, 2 and 3
Answer: B
Question 57
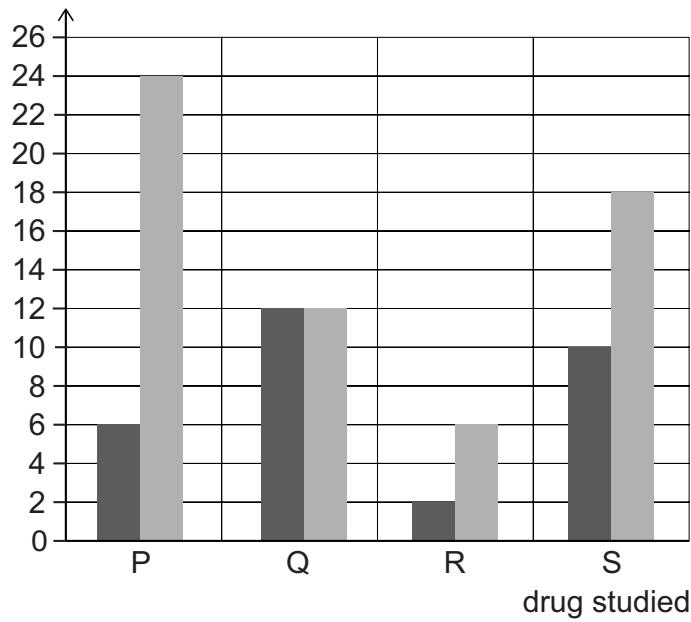
1 markScientists studied the processes by which drugs cross the cell membrane and enter cells.
The rate of uptake of four drugs, P, Q, R and S, was studied at 4 °C and at 37 °C. The results are shown in the chart. All other variables were kept constant.
[Bar chart showing 'rate of uptake of drug/arbitrary units' for drugs P, Q, R, S. Key: Dark grey bar for 4°C, light grey bar for 37°C.]
- Drug P: 4°C rate is ~8, 37°C rate is ~24.
- Drug Q: 4°C rate is ~14, 37°C rate is ~14.
- Drug R: 4°C rate is ~4, 37°C rate is ~8.
- Drug S: 4°C rate is ~12, 37°C rate is ~18.
Which of the following conclusions can be drawn from the results?
1 The percentage increase in rate of uptake of R from 4 °C to 37 °C is 2.5 times more than the percentage increase in the rate of uptake of S.
2 The concentration of Q must be the same inside and outside the cell.
3 P must be transported across the cell membrane using active transport only.
The rate of uptake of four drugs, P, Q, R and S, was studied at 4 °C and at 37 °C. The results are shown in the chart. All other variables were kept constant.
[Bar chart showing 'rate of uptake of drug/arbitrary units' for drugs P, Q, R, S. Key: Dark grey bar for 4°C, light grey bar for 37°C.]
- Drug P: 4°C rate is ~8, 37°C rate is ~24.
- Drug Q: 4°C rate is ~14, 37°C rate is ~14.
- Drug R: 4°C rate is ~4, 37°C rate is ~8.
- Drug S: 4°C rate is ~12, 37°C rate is ~18.
Which of the following conclusions can be drawn from the results?
1 The percentage increase in rate of uptake of R from 4 °C to 37 °C is 2.5 times more than the percentage increase in the rate of uptake of S.
2 The concentration of Q must be the same inside and outside the cell.
3 P must be transported across the cell membrane using active transport only.
- A.none of them
- B.1 only
- C.2 only
- D.3 only
- E.1 and 2 only
- F.1 and 3 only
- G.2 and 3 only
- H.1, 2 and 3
Answer: G
Question 58
1 markCommercial varieties of tomato are produced from wild varieties of tomato.
The genetic diversity of tomatoes can be measured and expressed as a number.
A population of wild varieties of tomato was found to have a genetic diversity of 0.30.
The table shows the genetic diversity of a population of commercial tomatoes grown at different times.
| year | genetic diversity |
|----------|-------------------|
| pre-1960 | 0.10 |
| 1960 | 0.05 |
| 1980 | 0.20 |
| 2000 | 0.30 |
Which of the following statements about these tomatoes could be correct?
1 Selective breeding of tomatoes occurred before 1960.
2 The addition of genetic material, enabling the tomatoes to produce memory cells so that they are resistant to diseases, increased the genetic diversity from 1960 onwards.
3 The average rate of increase in genetic diversity per day between 1960 and 2000 is approximately .
4 The increase in genetic diversity was 50% greater during the 1960 to 1980 period than the 1980 to 2000 period.
The genetic diversity of tomatoes can be measured and expressed as a number.
A population of wild varieties of tomato was found to have a genetic diversity of 0.30.
The table shows the genetic diversity of a population of commercial tomatoes grown at different times.
| year | genetic diversity |
|----------|-------------------|
| pre-1960 | 0.10 |
| 1960 | 0.05 |
| 1980 | 0.20 |
| 2000 | 0.30 |
Which of the following statements about these tomatoes could be correct?
1 Selective breeding of tomatoes occurred before 1960.
2 The addition of genetic material, enabling the tomatoes to produce memory cells so that they are resistant to diseases, increased the genetic diversity from 1960 onwards.
3 The average rate of increase in genetic diversity per day between 1960 and 2000 is approximately .
4 The increase in genetic diversity was 50% greater during the 1960 to 1980 period than the 1980 to 2000 period.
- A.1 and 2 only
- B.1 and 3 only
- C.1 and 4 only
- D.2 and 3 only
- E.2 and 4 only
- F.1, 2 and 3 only
- G.1, 3 and 4 only
- H.2, 3 and 4 only
Answer: G
Question 59
1 markA mathematical test can be used to determine whether there is a statistically significant difference between the expected and the observed number of individuals with each phenotype in a population.
The value required for this test is calculated using the following expression:
where each term uses the observed number of individuals and expected number of individuals with each phenotype in turn.
In a monohybrid cross between two individuals that showed the same phenotype, 160 offspring were produced. 36 of these offspring showed a different phenotype to both parents for the same characteristic.
The characteristic is controlled by a single gene with one dominant allele and one recessive allele.
Which of the following expressions calculates the value required for the mathematical test for this cross?
(Assume no mutations and that no genotype results in the death of individuals.)
The value required for this test is calculated using the following expression:
where each term uses the observed number of individuals and expected number of individuals with each phenotype in turn.
In a monohybrid cross between two individuals that showed the same phenotype, 160 offspring were produced. 36 of these offspring showed a different phenotype to both parents for the same characteristic.
The characteristic is controlled by a single gene with one dominant allele and one recessive allele.
Which of the following expressions calculates the value required for the mathematical test for this cross?
(Assume no mutations and that no genotype results in the death of individuals.)
- A.
- B.
- C.
- D.
- E.
- F.
- G.
- H.
Answer: C
Question 60
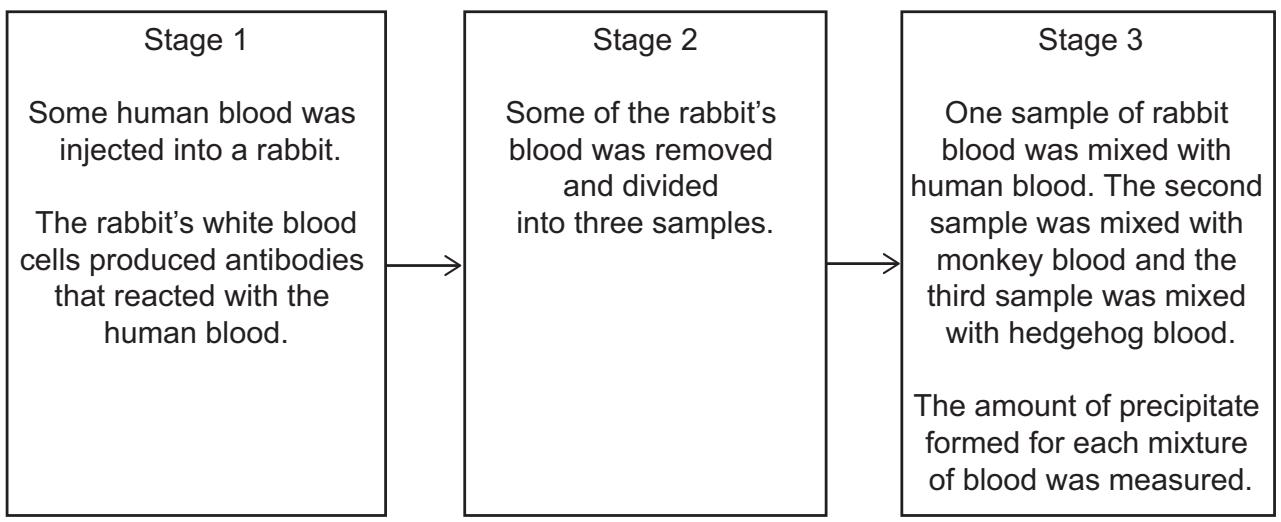
1 markAn investigation was carried out to discover the evolutionary relationships between three different species of mammal, a human, a monkey and a hedgehog, as shown in the flow diagram:
Stage 1: Some human blood was injected into a rabbit. The rabbit's white blood cells produced antibodies that reacted with the human blood.
Stage 2: Some of the rabbit's blood was removed and divided into three samples.
Stage 3: One sample of rabbit blood was mixed with human blood. The second sample was mixed with monkey blood and the third sample was mixed with hedgehog blood. The amount of precipitate formed for each mixture of blood was measured.
When an antigen binds to an antibody, a precipitate is formed, which is measured in stage 3.
Some of the results for stage 3 are shown in the table.
P and Q each represent one of the non-human mammals.
| species of mammal | amount of precipitate formed / arbitrary units |
|-------------------|------------------------------------------------|
| P | 58 |
| Q | 17 |
Which row is correct for this investigation?
Stage 1: Some human blood was injected into a rabbit. The rabbit's white blood cells produced antibodies that reacted with the human blood.
Stage 2: Some of the rabbit's blood was removed and divided into three samples.
Stage 3: One sample of rabbit blood was mixed with human blood. The second sample was mixed with monkey blood and the third sample was mixed with hedgehog blood. The amount of precipitate formed for each mixture of blood was measured.
When an antigen binds to an antibody, a precipitate is formed, which is measured in stage 3.
Some of the results for stage 3 are shown in the table.
P and Q each represent one of the non-human mammals.
| species of mammal | amount of precipitate formed / arbitrary units |
|-------------------|------------------------------------------------|
| P | 58 |
| Q | 17 |
Which row is correct for this investigation?
- A.biological molecules that form antibodies in stage 1: amino acids, the amount of precipitate formed for the sample with human blood in stage 3 / arbitrary units: greater than 58, species Q: monkey
- B.biological molecules that form antibodies in stage 1: amino acids, the amount of precipitate formed for the sample with human blood in stage 3 / arbitrary units: greater than 58, species Q: hedgehog
- C.biological molecules that form antibodies in stage 1: amino acids, the amount of precipitate formed for the sample with human blood in stage 3 / arbitrary units: less than 17, species Q: monkey
- D.biological molecules that form antibodies in stage 1: amino acids, the amount of precipitate formed for the sample with human blood in stage 3 / arbitrary units: less than 17, species Q: hedgehog
- E.biological molecules that form antibodies in stage 1: nucleotides, the amount of precipitate formed for the sample with human blood in stage 3 / arbitrary units: greater than 58, species Q: monkey
- F.biological molecules that form antibodies in stage 1: nucleotides, the amount of precipitate formed for the sample with human blood in stage 3 / arbitrary units: greater than 58, species Q: hedgehog
- G.biological molecules that form antibodies in stage 1: nucleotides, the amount of precipitate formed for the sample with human blood in stage 3 / arbitrary units: less than 17, species Q: monkey
- H.biological molecules that form antibodies in stage 1: nucleotides, the amount of precipitate formed for the sample with human blood in stage 3 / arbitrary units: less than 17, species Q: hedgehog
Answer: B