Mapped to the ESAT specification
NSAA 2022 Biology Part Z
17 questions17 marksUpdated October 2025
Natural Sciences Admissions Assessment 2022 is one of the closest available past papers for the Engineering and Science Admissions Test. Below, all 17 questions are mapped to the ESAT topics they test, each with its answer. Sit it cold under exam timing, then work back through anything you missed using the solutions.
What this paper covers on the ESAT
Every question mapped to the Engineering and Science Admissions Test specification, so you know exactly which areas it tests.
Mathematics 1
- Algebra (4)
- Geometry (2)
- Ratio and proportion (1)
Biology
- Cells (3)
- Movement across membranes (3)
- Enzymes (2)
- Gene technologies (1)
Questions and answers are free. Full step-by-step worked solutions unlock with a free account. Start practising.
Question 41
1 markA solution containing sucrose, starch and amylase was incubated at 37 °C. After the reactions had completed, the student divided the solution into three test tubes and carried out the following tests:
• add biuret reagent
• add iodine solution
• add Benedict's solution and heat
Which row shows the final colours after the tests?
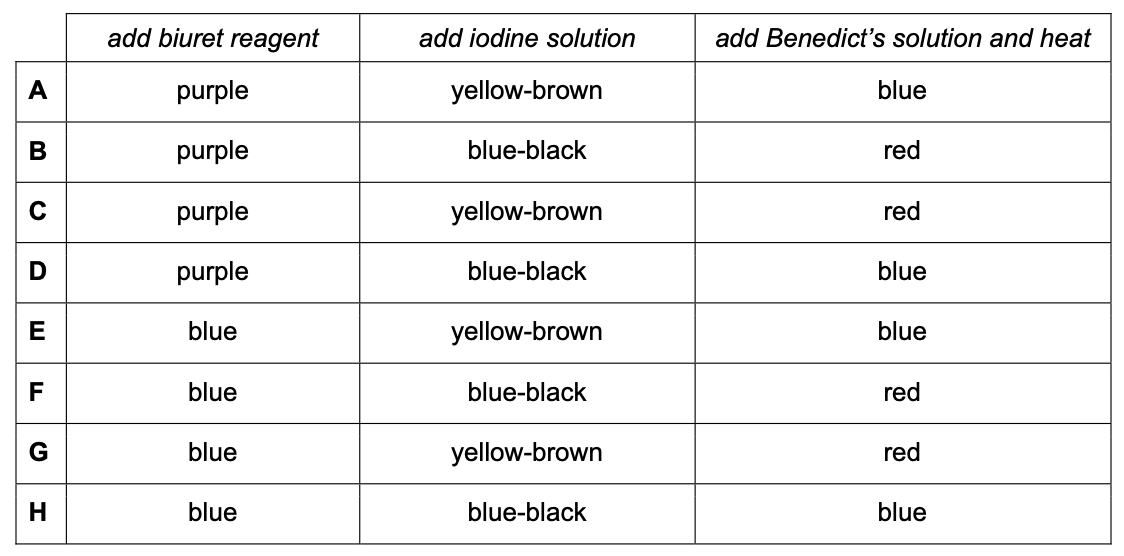
• add biuret reagent
• add iodine solution
• add Benedict's solution and heat
Which row shows the final colours after the tests?
- A.add biuret reagent: purple, add iodine solution: yellow-brown, add Benedict's solution and heat: blue
- B.add biuret reagent: purple, add iodine solution: blue-black, add Benedict's solution and heat: red
- C.add biuret reagent: purple, add iodine solution: yellow-brown, add Benedict's solution and heat: red
- D.add biuret reagent: purple, add iodine solution: blue-black, add Benedict's solution and heat: blue
- E.add biuret reagent: blue, add iodine solution: yellow-brown, add Benedict's solution and heat: blue
- F.add biuret reagent: blue, add iodine solution: blue-black, add Benedict's solution and heat: red
- G.add biuret reagent: blue, add iodine solution: yellow-brown, add Benedict's solution and heat: red
- H.add biuret reagent: blue, add iodine solution: blue-black, add Benedict's solution and heat: blue
Answer: C
Question 42
1 markA sample of blood was taken from a healthy human.
There were red blood cells in of the blood.
The ratio of the volume of red blood cells to other blood components was 2:3.
Which of the following statements is/are correct?
1 The genetic material of a mature red blood cell is contained in its nucleus.
2 The mean volume of a red blood cell is .
3 Human red blood cells have a higher surface area to volume ratio compared to a spherical cell of the same volume.
There were red blood cells in of the blood.
The ratio of the volume of red blood cells to other blood components was 2:3.
Which of the following statements is/are correct?
1 The genetic material of a mature red blood cell is contained in its nucleus.
2 The mean volume of a red blood cell is .
3 Human red blood cells have a higher surface area to volume ratio compared to a spherical cell of the same volume.
- A.none of them
- B.1 only
- C.2 only
- D.3 only
- E.1 and 2 only
- F.1 and 3 only
- G.2 and 3 only
- H.1, 2 and 3
Answer: G
Question 43
1 markAn enzyme called EcoRI is used to cut out a gene from the middle of a human chromosome. This process produces sticky ends as shown in the diagram.
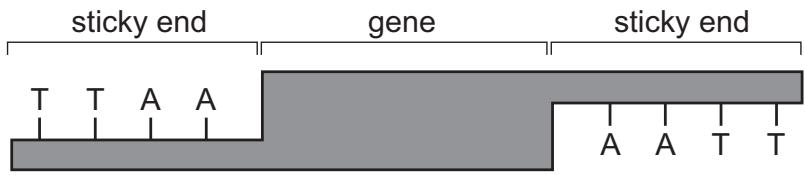
When guanine separates from its complementary base, three hydrogen bonds are broken, whereas two are broken when the other pair of bases separate.
Which row is correct?
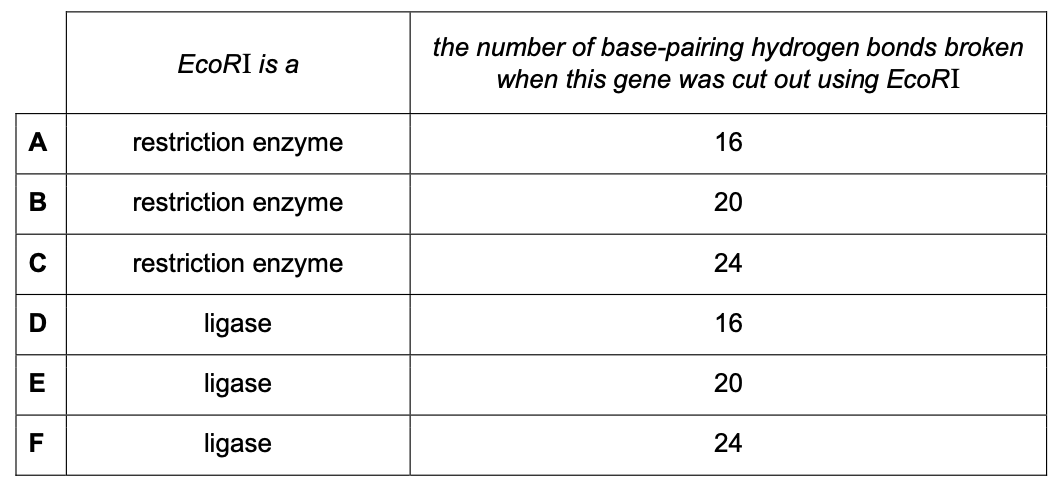
When guanine separates from its complementary base, three hydrogen bonds are broken, whereas two are broken when the other pair of bases separate.
Which row is correct?
- A.EcoRI is a: restriction enzyme, the number of base-pairing hydrogen bonds broken when this gene was cut out using EcoRI: 16
- B.EcoRI is a: restriction enzyme, the number of base-pairing hydrogen bonds broken when this gene was cut out using EcoRI: 20
- C.EcoRI is a: restriction enzyme, the number of base-pairing hydrogen bonds broken when this gene was cut out using EcoRI: 24
- D.EcoRI is a: ligase, the number of base-pairing hydrogen bonds broken when this gene was cut out using EcoRI: 16
- E.EcoRI is a: ligase, the number of base-pairing hydrogen bonds broken when this gene was cut out using EcoRI: 20
- F.EcoRI is a: ligase, the number of base-pairing hydrogen bonds broken when this gene was cut out using EcoRI: 24
Answer: A
Question 44
1 markA student studied the effect of different colours of light on photosynthesis by algae. Large numbers of algal cells were trapped inside balls of a clear jelly-like substance. The average diameter of the algal balls was 5 mm.
These balls were then placed in a test tube filled with a solution. The solution contained substances necessary for photosynthesis by the algal cells, and had a pH of 7.8. The whole test tube was then wrapped in a coloured filter and left in bright light for two hours. All other factors were kept constant.
After two hours the pH of each solution was measured. The results are shown in the table.
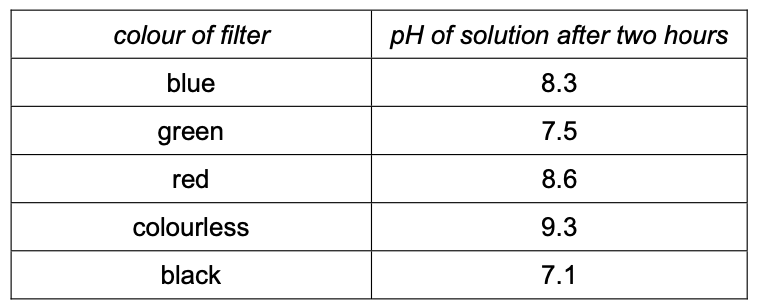
The volume of a sphere is , where r is the radius.
Which of the following statements is/are correct?
1 The average volume of one of the algal balls is .
2 In only the test tubes with red, blue and colourless filters, the increase in pH can be explained by an increase in the amount of carbon dioxide released by the algal balls.
3 Conducting these experiments at a higher temperature could increase the rate of change in pH in all the tubes.
These balls were then placed in a test tube filled with a solution. The solution contained substances necessary for photosynthesis by the algal cells, and had a pH of 7.8. The whole test tube was then wrapped in a coloured filter and left in bright light for two hours. All other factors were kept constant.
After two hours the pH of each solution was measured. The results are shown in the table.
The volume of a sphere is , where r is the radius.
Which of the following statements is/are correct?
1 The average volume of one of the algal balls is .
2 In only the test tubes with red, blue and colourless filters, the increase in pH can be explained by an increase in the amount of carbon dioxide released by the algal balls.
3 Conducting these experiments at a higher temperature could increase the rate of change in pH in all the tubes.
- A.none of them
- B.1 only
- C.2 only
- D.3 only
- E.1 and 2 only
- F.1 and 3 only
- G.2 and 3 only
- H.1, 2 and 3
Answer: D
Question 45
1 markIn a test to compare the function of the human respiratory system in different individuals, they were asked to breathe out as hard as possible for as long as possible. The volume exhaled was recorded.
The graph shows the results obtained after carrying out this test on two males with the same height and body mass.
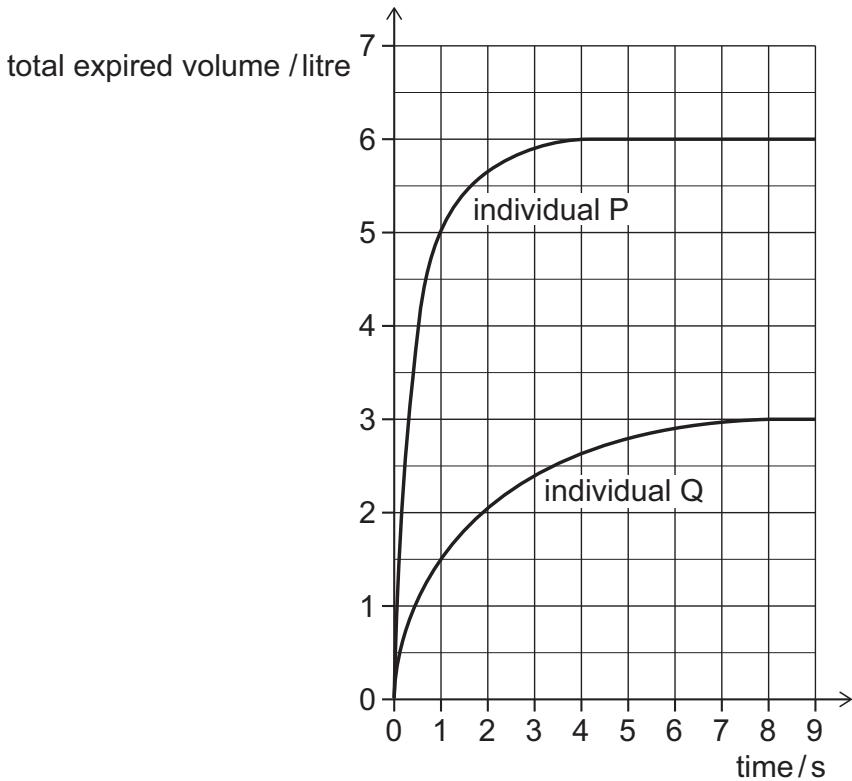
Which of the following statements is/are correct?
1 Individual P exhaled 200% more than individual Q.
2 Individual Q's diaphragm was more domed at 7 seconds than at 2 seconds.
3 The mean rate of air flow in the first second was 233% more in individual P than in individual Q (to the nearest whole percentage).
The graph shows the results obtained after carrying out this test on two males with the same height and body mass.
Which of the following statements is/are correct?
1 Individual P exhaled 200% more than individual Q.
2 Individual Q's diaphragm was more domed at 7 seconds than at 2 seconds.
3 The mean rate of air flow in the first second was 233% more in individual P than in individual Q (to the nearest whole percentage).
- A.none of them
- B.1 only
- C.2 only
- D.3 only
- E.1 and 2 only
- F.1 and 3 only
- G.2 and 3 only
- H.1, 2 and 3
Answer: G
Question 46
1 markThe graph shows the mass of antibody produced by antibody-producing cells over a period of 20 hours.
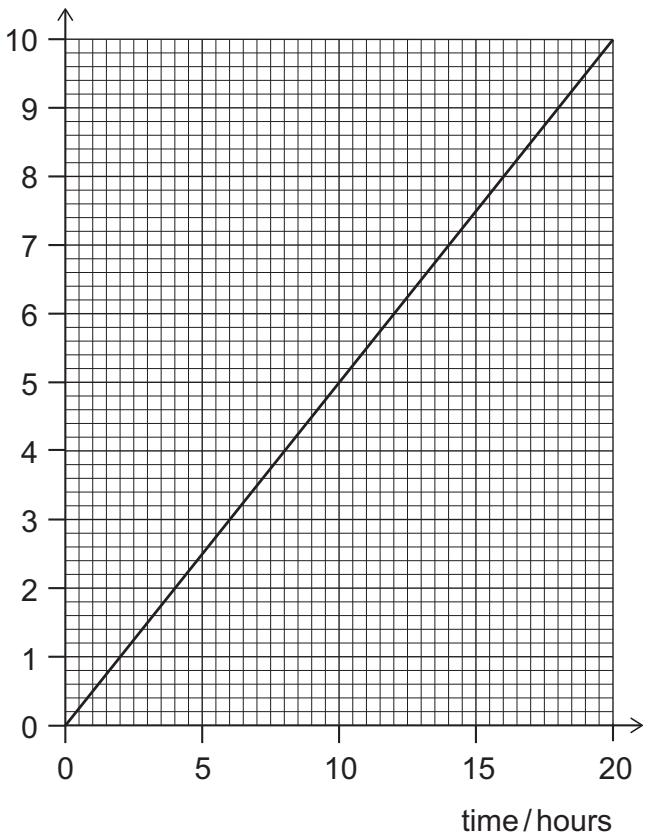
Assume that one antibody molecule has a mass of g.
Which of the following statements is/are correct?
1 One antibody-producing cell produces antibody molecules per hour.
2 Antibodies are produced in response to dead and living pathogens.
3 Phagocytes produce antibodies.
Assume that one antibody molecule has a mass of g.
Which of the following statements is/are correct?
1 One antibody-producing cell produces antibody molecules per hour.
2 Antibodies are produced in response to dead and living pathogens.
3 Phagocytes produce antibodies.
- A.none of them
- B.1 only
- C.2 only
- D.3 only
- E.1 and 2 only
- F.1 and 3 only
- G.2 and 3 only
- H.1, 2 and 3
Answer: E
Question 47
1 markThe table identifies various values relating to microscopy.
Which row in the table is correct?
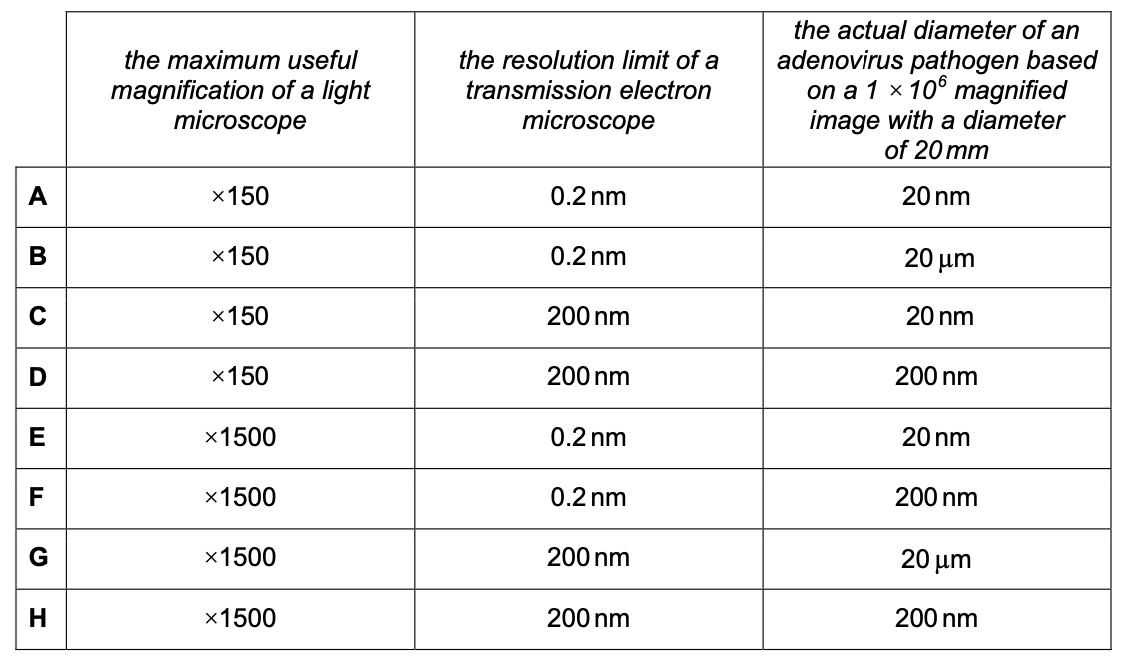
Which row in the table is correct?
- A.the maximum useful magnification of a light microscope: x150, the resolution limit of a transmission electron microscope: 0.2 nm, the actual diameter of an adenovirus pathogen based on a magnified image with a diameter of 20 mm: 20 nm
- B.the maximum useful magnification of a light microscope: x150, the resolution limit of a transmission electron microscope: 0.2 nm, the actual diameter of an adenovirus pathogen based on a magnified image with a diameter of 20 mm: 20 µm
- C.the maximum useful magnification of a light microscope: x150, the resolution limit of a transmission electron microscope: 200 nm, the actual diameter of an adenovirus pathogen based on a magnified image with a diameter of 20 mm: 20 nm
- D.the maximum useful magnification of a light microscope: x150, the resolution limit of a transmission electron microscope: 200 nm, the actual diameter of an adenovirus pathogen based on a magnified image with a diameter of 20 mm: 200 nm
- E.the maximum useful magnification of a light microscope: x1500, the resolution limit of a transmission electron microscope: 0.2 nm, the actual diameter of an adenovirus pathogen based on a magnified image with a diameter of 20 mm: 20 nm
- F.the maximum useful magnification of a light microscope: x1500, the resolution limit of a transmission electron microscope: 0.2 nm, the actual diameter of an adenovirus pathogen based on a magnified image with a diameter of 20 mm: 200 nm
- G.the maximum useful magnification of a light microscope: x1500, the resolution limit of a transmission electron microscope: 200 nm, the actual diameter of an adenovirus pathogen based on a magnified image with a diameter of 20 mm: 20 µm
- H.the maximum useful magnification of a light microscope: x1500, the resolution limit of a transmission electron microscope: 200 nm, the actual diameter of an adenovirus pathogen based on a magnified image with a diameter of 20 mm: 200 nm
Answer: E
Question 48
1 markComplete ribosomes are made from one large subunit and one small subunit joined together. The subunit names are based on their sizes as shown in the table.
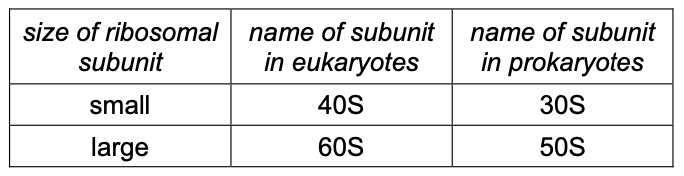
In a study, scientists found that one organism made and assembled the subunits in its nucleus. The complete ribosome was then transported to the cytoplasm.
Which row is correct?
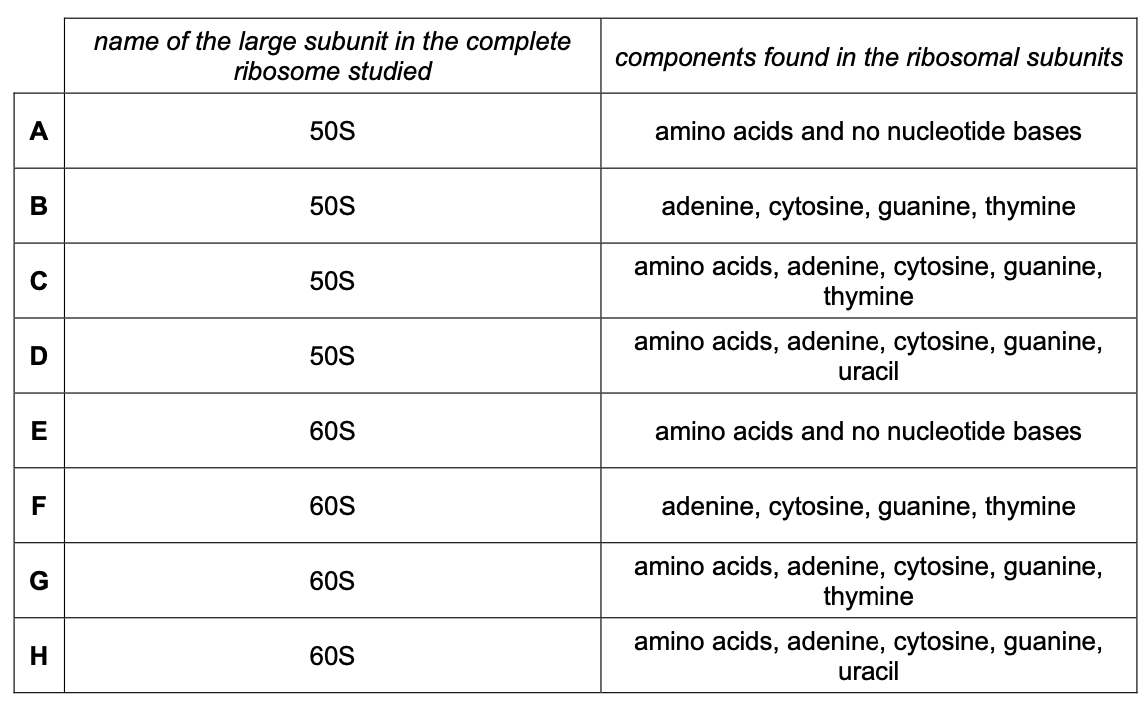
In a study, scientists found that one organism made and assembled the subunits in its nucleus. The complete ribosome was then transported to the cytoplasm.
Which row is correct?
- A.name of the large subunit in the complete ribosome studied: 50S, components found in the ribosomal subunits: amino acids and no nucleotide bases
- B.name of the large subunit in the complete ribosome studied: 50S, components found in the ribosomal subunits: adenine, cytosine, guanine, thymine
- C.name of the large subunit in the complete ribosome studied: 50S, components found in the ribosomal subunits: amino acids, adenine, cytosine, guanine, thymine
- D.name of the large subunit in the complete ribosome studied: 50S, components found in the ribosomal subunits: amino acids, adenine, cytosine, guanine, uracil
- E.name of the large subunit in the complete ribosome studied: 60S, components found in the ribosomal subunits: amino acids and no nucleotide bases
- F.name of the large subunit in the complete ribosome studied: 60S, components found in the ribosomal subunits: adenine, cytosine, guanine, thymine
- G.name of the large subunit in the complete ribosome studied: 60S, components found in the ribosomal subunits: amino acids, adenine, cytosine, guanine, thymine
- H.name of the large subunit in the complete ribosome studied: 60S, components found in the ribosomal subunits: amino acids, adenine, cytosine, guanine, uracil
Answer: H
Question 49
1 markSome varieties of plant crops, like maize, can survive at low temperatures, such as 4°C.
Scientists identified protein Z that they believe to be involved in the response to low temperatures in maize.
One method of studying how plants survive at low temperatures is to investigate the levels of ion leakage from cells damaged by the low temperatures. Higher levels of ion leakage are associated with lower levels of survival.
The scientists measured the levels of ions leaking from cells of three varieties of maize.
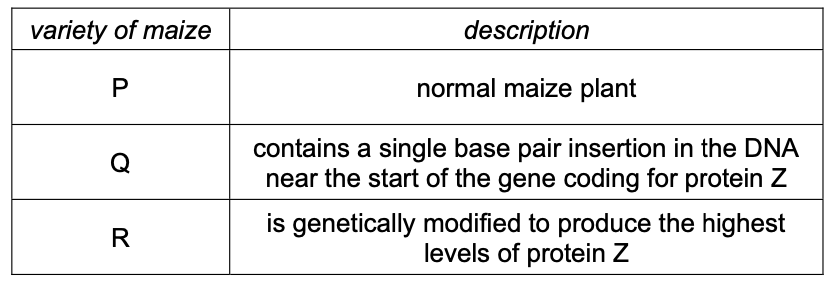
Other than the changes listed in the table, the plants were genetically identical.
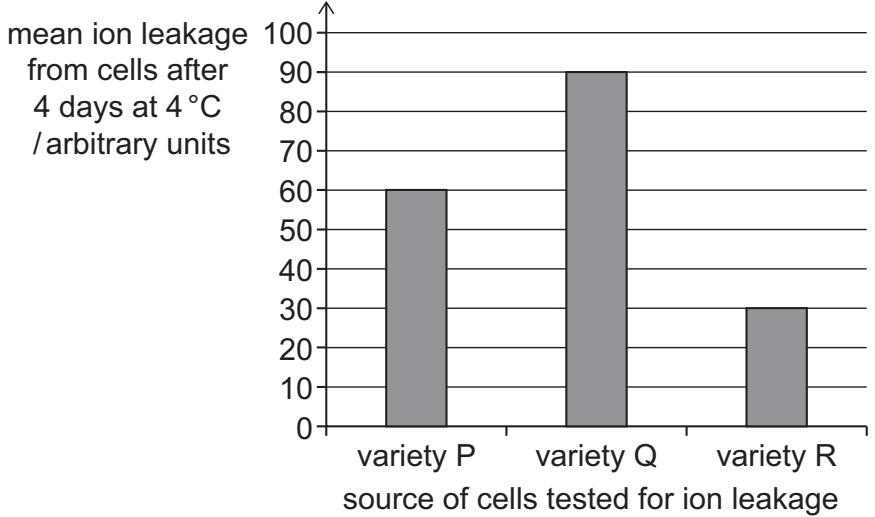
Ion leakage from samples of cells of each variety was measured after the plants had been kept at 4°C for 4 days. All other variables were kept constant.
The results of this investigation are shown in the chart.
Which of the following statements is/are correct?
1 The cell wall in maize cells controls the leakage of ions from the cell at 4°C.
2 Inserting an extra base pair near the start of the gene for protein Z could change the overall amino acid sequence of the protein.
3 The presence of protein Z in maize cells increases the chance of the maize plant surviving at 4°C.
Scientists identified protein Z that they believe to be involved in the response to low temperatures in maize.
One method of studying how plants survive at low temperatures is to investigate the levels of ion leakage from cells damaged by the low temperatures. Higher levels of ion leakage are associated with lower levels of survival.
The scientists measured the levels of ions leaking from cells of three varieties of maize.
Other than the changes listed in the table, the plants were genetically identical.
Ion leakage from samples of cells of each variety was measured after the plants had been kept at 4°C for 4 days. All other variables were kept constant.
The results of this investigation are shown in the chart.
Which of the following statements is/are correct?
1 The cell wall in maize cells controls the leakage of ions from the cell at 4°C.
2 Inserting an extra base pair near the start of the gene for protein Z could change the overall amino acid sequence of the protein.
3 The presence of protein Z in maize cells increases the chance of the maize plant surviving at 4°C.
- A.none of them
- B.1 only
- C.2 only
- D.3 only
- E.1 and 2 only
- F.1 and 3 only
- G.2 and 3 only
- H.1, 2 and 3
Answer: G
Question 50
1 markSome bacteria become resistant to antibiotics due to the loss of the proteins in their cell surface membranes that the antibiotic uses to enter the cell. To overcome this problem, scientists have developed nanomachines that can make holes in these membranes, allowing the antibiotic to enter and destroy the bacteria.
Scientists studied the effects of these nanomachines in two antibiotic-resistant strains of bacteria, R and S. Each culture started with living cells. They carried out two sets of experiments, one without the nanomachines and one with the nanomachines. The results are shown in the chart.
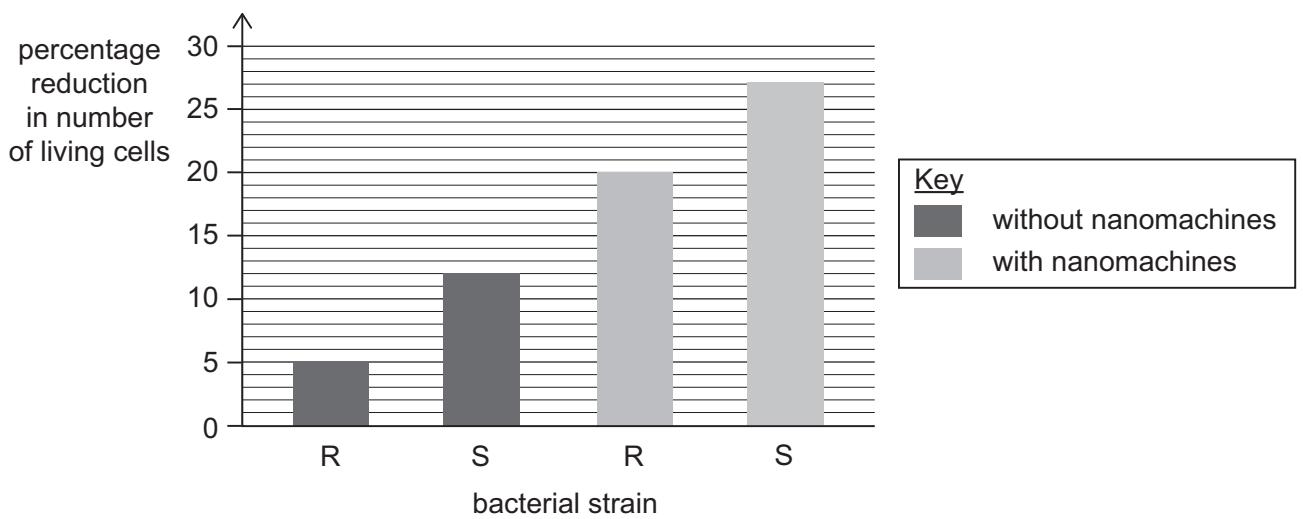
All other factors were kept the same.
Which of the following statements is/are correct?
1 The number of living cells of strain S in the experiment with the nanomachines is 2.25 times higher than in the experiment without the nanomachines.
2 The cells of strain S may have more proteins in their cell membranes than strain R, which allow the antibiotic to enter their cells.
3 There would be living cells of strain R at the end of the experiment with the nanomachines.
Scientists studied the effects of these nanomachines in two antibiotic-resistant strains of bacteria, R and S. Each culture started with living cells. They carried out two sets of experiments, one without the nanomachines and one with the nanomachines. The results are shown in the chart.
All other factors were kept the same.
Which of the following statements is/are correct?
1 The number of living cells of strain S in the experiment with the nanomachines is 2.25 times higher than in the experiment without the nanomachines.
2 The cells of strain S may have more proteins in their cell membranes than strain R, which allow the antibiotic to enter their cells.
3 There would be living cells of strain R at the end of the experiment with the nanomachines.
- A.none of them
- B.1 only
- C.2 only
- D.3 only
- E.1 and 2 only
- F.1 and 3 only
- G.2 and 3 only
- H.1, 2 and 3
Answer: G
Question 51
1 markSome chemotherapy drugs interfere with the mitotic cell cycle.
The following table lists five chemotherapy drugs and their mechanisms of action.
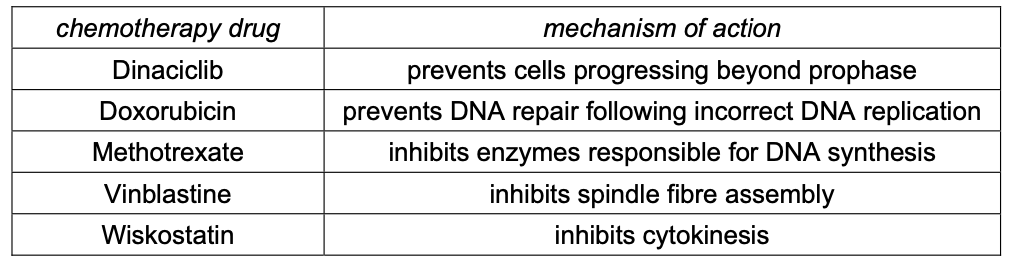
The following diagram shows a simplified version of the mitotic cell cycle.
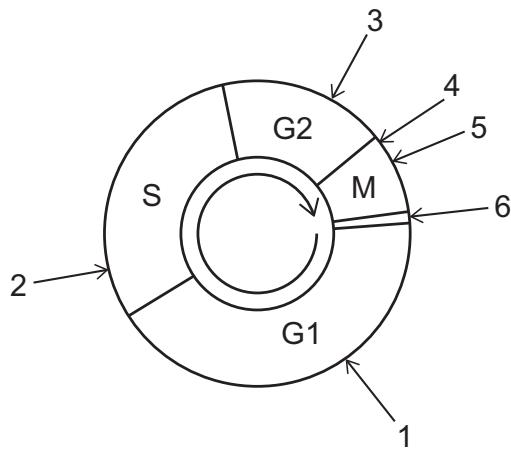
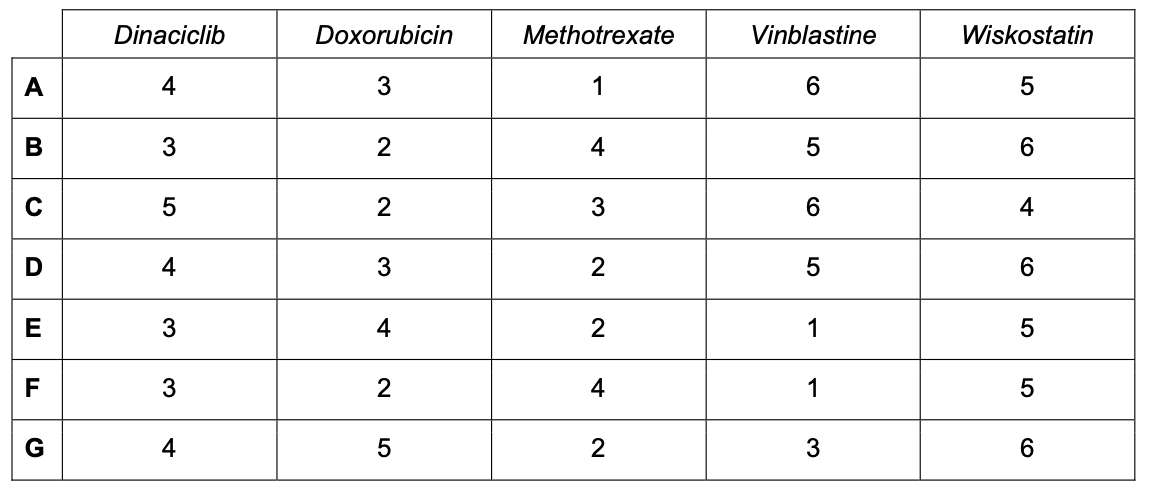
Which row identifies the position on the diagram where each chemotherapy drug is most likely to act?
The following table lists five chemotherapy drugs and their mechanisms of action.
The following diagram shows a simplified version of the mitotic cell cycle.
Which row identifies the position on the diagram where each chemotherapy drug is most likely to act?
- A.Dinaciclib: 4, Doxorubicin: 3, Methotrexate: 1, Vinblastine: 6, Wiskostatin: 5
- B.Dinaciclib: 3, Doxorubicin: 2, Methotrexate: 4, Vinblastine: 5, Wiskostatin: 6
- C.Dinaciclib: 5, Doxorubicin: 2, Methotrexate: 3, Vinblastine: 6, Wiskostatin: 4
- D.Dinaciclib: 4, Doxorubicin: 3, Methotrexate: 2, Vinblastine: 5, Wiskostatin: 6
- E.Dinaciclib: 3, Doxorubicin: 4, Methotrexate: 2, Vinblastine: 1, Wiskostatin: 5
- F.Dinaciclib: 3, Doxorubicin: 2, Methotrexate: 4, Vinblastine: 1, Wiskostatin: 5
- G.Dinaciclib: 4, Doxorubicin: 5, Methotrexate: 2, Vinblastine: 3, Wiskostatin: 6
Answer: D
Question 52
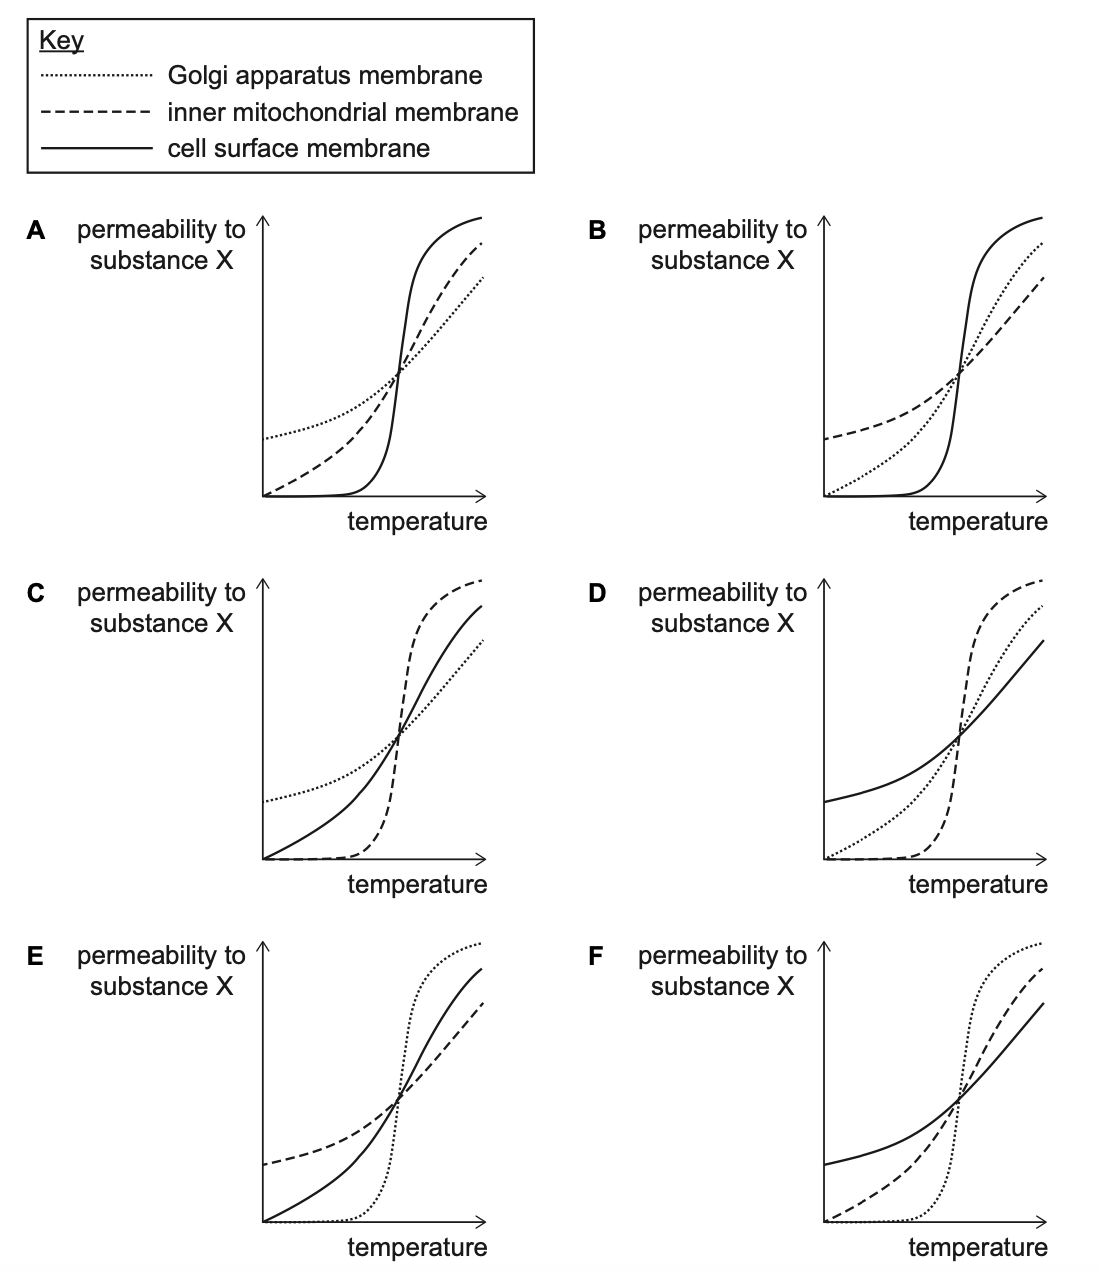
1 markThe properties of three biological membranes were investigated. It was found that:
• There is a positive correlation between the fluidity of a membrane and the rate of simple diffusion of substance X across it.
• Cholesterol increases the fluidity of membranes at low temperatures, but decreases their fluidity at high temperatures.
• The cell surface membrane has the highest percentage of cholesterol, and the lysosomal membrane has the second highest percentage of cholesterol.
Which of the following sketch graphs is consistent with this information?
• There is a positive correlation between the fluidity of a membrane and the rate of simple diffusion of substance X across it.
• Cholesterol increases the fluidity of membranes at low temperatures, but decreases their fluidity at high temperatures.
• The cell surface membrane has the highest percentage of cholesterol, and the lysosomal membrane has the second highest percentage of cholesterol.
Which of the following sketch graphs is consistent with this information?
- A.Graph A
- B.Graph B
- C.Graph C
- D.Graph D
- E.Graph E
- F.Graph F
Answer: D
Question 53
1 markA 0.2 cm long section of xylem, with internal diameter 60 µm, was studied.
The velocity at which substances were transported through the xylem in a plant was found to be 3.6 metres per hour in the morning. Later in the day the velocity was greater.
Which row of the table is correct?
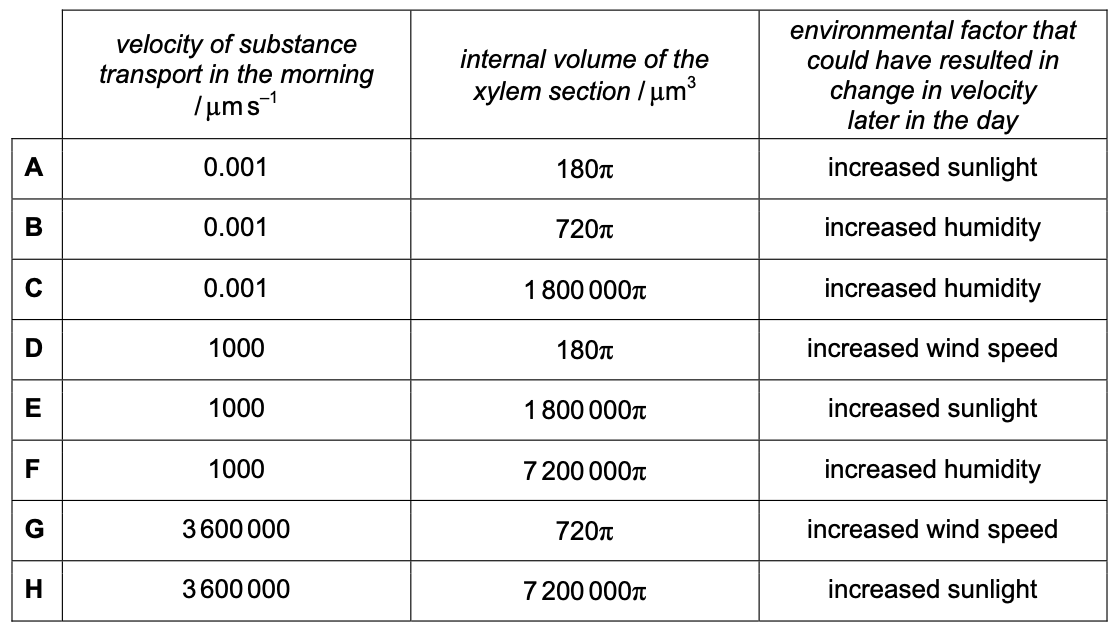
The velocity at which substances were transported through the xylem in a plant was found to be 3.6 metres per hour in the morning. Later in the day the velocity was greater.
Which row of the table is correct?
- A.velocity of substance transport in the morning /µms⁻¹: 0.001, internal volume of the xylem section / µm³: 180π, environmental factor that could have resulted in change in velocity later in the day: increased sunlight
- B.velocity of substance transport in the morning /µms⁻¹: 0.001, internal volume of the xylem section / µm³: 720π, environmental factor that could have resulted in change in velocity later in the day: increased humidity
- C.velocity of substance transport in the morning /µms⁻¹: 0.001, internal volume of the xylem section / µm³: 1800000π, environmental factor that could have resulted in change in velocity later in the day: increased humidity
- D.velocity of substance transport in the morning /µms⁻¹: 1000, internal volume of the xylem section / µm³: 180π, environmental factor that could have resulted in change in velocity later in the day: increased wind speed
- E.velocity of substance transport in the morning /µms⁻¹: 1000, internal volume of the xylem section / µm³: 1800000π, environmental factor that could have resulted in change in velocity later in the day: increased sunlight
- F.velocity of substance transport in the morning /µms⁻¹: 1000, internal volume of the xylem section / µm³: 7200000π, environmental factor that could have resulted in change in velocity later in the day: increased humidity
- G.velocity of substance transport in the morning /µms⁻¹: 3600000, internal volume of the xylem section / µm³: 720π, environmental factor that could have resulted in change in velocity later in the day: increased wind speed
- H.velocity of substance transport in the morning /µms⁻¹: 3600000, internal volume of the xylem section / µm³: 7200000π, environmental factor that could have resulted in change in velocity later in the day: increased sunlight
Answer: E
Question 54
1 markIn cold conditions mice maintain their core body temperature by increased heat production.
The graph shows the effect of environmental temperature on oxygen consumption by one strain of mouse.
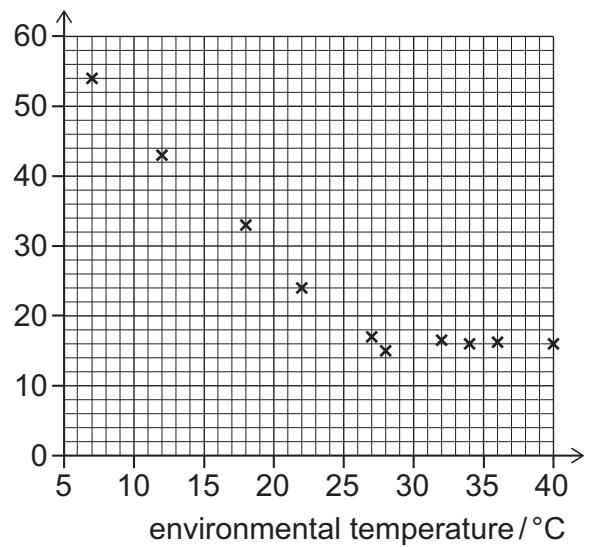
Mice of the same strain have been produced with a mutation that results in a thinner and less insulating layer of fat in their skin.
Which of the following statements is/are correct?
1 The homeostatic control of core body temperature only occurs in environmental temperatures between 28 °C and 40 °C.
2 Between 12°C and 18°C, each 1 °C increase in temperature decreases the mean oxygen consumption by arbitrary units.
3 Between 10°C and 20°C, the change in oxygen consumption for the mice with the mutation will decrease more than for the non-mutated mice.
The graph shows the effect of environmental temperature on oxygen consumption by one strain of mouse.
Mice of the same strain have been produced with a mutation that results in a thinner and less insulating layer of fat in their skin.
Which of the following statements is/are correct?
1 The homeostatic control of core body temperature only occurs in environmental temperatures between 28 °C and 40 °C.
2 Between 12°C and 18°C, each 1 °C increase in temperature decreases the mean oxygen consumption by arbitrary units.
3 Between 10°C and 20°C, the change in oxygen consumption for the mice with the mutation will decrease more than for the non-mutated mice.
- A.none of them
- B.1 only
- C.2 only
- D.3 only
- E.1 and 2 only
- F.1 and 3 only
- G.2 and 3 only
- H.1, 2 and 3
Answer: G
Question 55
1 markA scientist studied the aorta, a renal artery and a capillary in a healthy human.
The scientist measured the radii of two of the vessels, P and Q, and made a drawing of the third, R.
• P: lumen radius = m
• Q: lumen radius = 8000 µm
• R: at magnification ×5000, diameter of lumen in drawing = 4.5 cm
Which row identifies the three blood vessels?
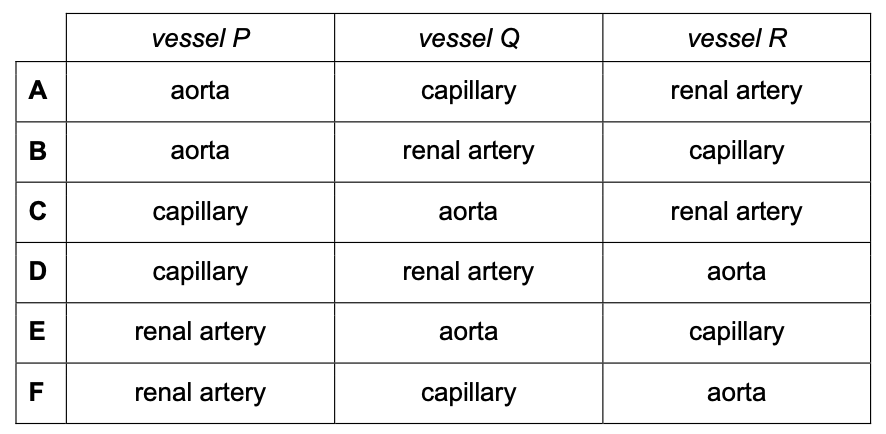
The scientist measured the radii of two of the vessels, P and Q, and made a drawing of the third, R.
• P: lumen radius = m
• Q: lumen radius = 8000 µm
• R: at magnification ×5000, diameter of lumen in drawing = 4.5 cm
Which row identifies the three blood vessels?
- A.vessel P: aorta, vessel Q: capillary, vessel R: renal artery
- B.vessel P: aorta, vessel Q: renal artery, vessel R: capillary
- C.vessel P: capillary, vessel Q: aorta, vessel R: renal artery
- D.vessel P: capillary, vessel Q: renal artery, vessel R: aorta
- E.vessel P: renal artery, vessel Q: aorta, vessel R: capillary
- F.vessel P: renal artery, vessel Q: capillary, vessel R: aorta
Answer: E
Question 56
1 markA student investigated the effect of increasing the size of an agar (a jelly-like substance) cube on its efficiency to absorb and distribute a blue dye.
Two agar cubes were prepared, one with side lengths of 1 cm and the other with side lengths of 3 cm. They were put in a solution of blue dye for 30 minutes.
The cubes were then removed from the dye and cut in half to measure the penetration of the dye into the agar.
In the 3 cm cube the dye had penetrated to a depth of 0.75 cm. The cross section of this cube is shown:
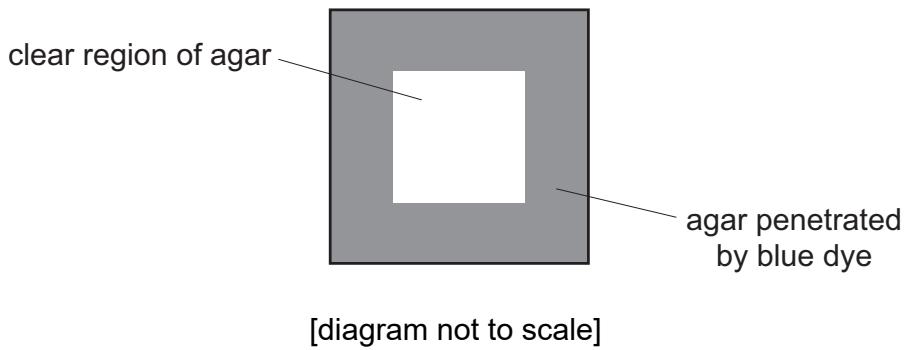
When the cube with sides of 1 cm was cut in half, all the agar had been penetrated with the dye.
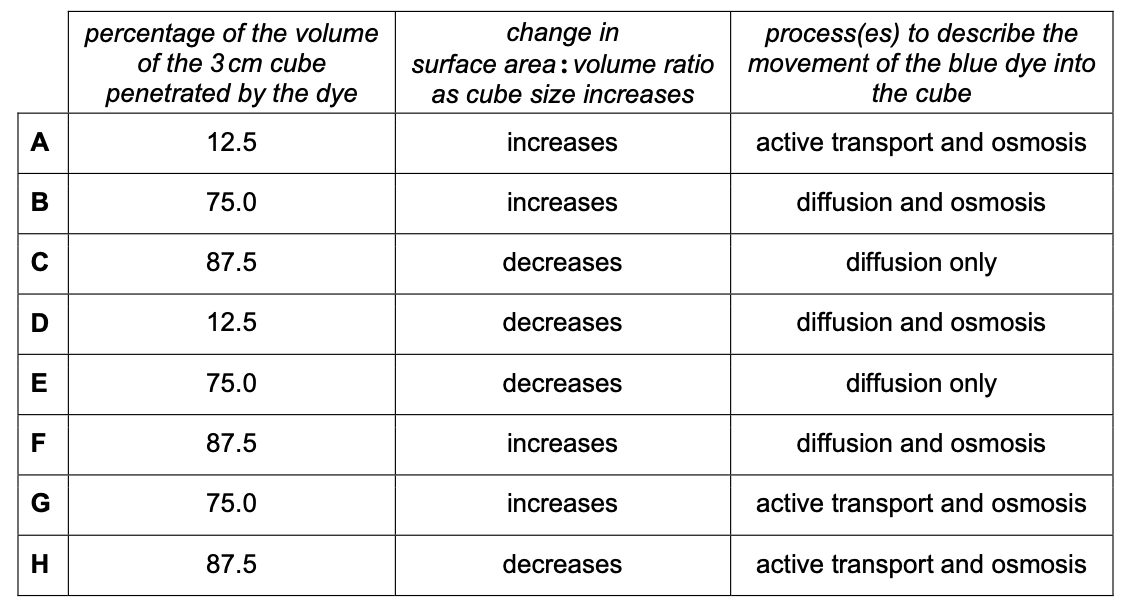
Which row is correct for this investigation?
Two agar cubes were prepared, one with side lengths of 1 cm and the other with side lengths of 3 cm. They were put in a solution of blue dye for 30 minutes.
The cubes were then removed from the dye and cut in half to measure the penetration of the dye into the agar.
In the 3 cm cube the dye had penetrated to a depth of 0.75 cm. The cross section of this cube is shown:
When the cube with sides of 1 cm was cut in half, all the agar had been penetrated with the dye.
Which row is correct for this investigation?
- A.percentage of the volume of the 3 cm cube penetrated by the dye: 12.5, change in surface area:volume ratio as cube size increases: increases, process(es) to describe the movement of the blue dye into the cube: active transport and osmosis
- B.percentage of the volume of the 3 cm cube penetrated by the dye: 75.0, change in surface area:volume ratio as cube size increases: increases, process(es) to describe the movement of the blue dye into the cube: diffusion and osmosis
- C.percentage of the volume of the 3 cm cube penetrated by the dye: 87.5, change in surface area:volume ratio as cube size increases: decreases, process(es) to describe the movement of the blue dye into the cube: diffusion only
- D.percentage of the volume of the 3 cm cube penetrated by the dye: 12.5, change in surface area:volume ratio as cube size increases: decreases, process(es) to describe the movement of the blue dye into the cube: diffusion and osmosis
- E.percentage of the volume of the 3 cm cube penetrated by the dye: 75.0, change in surface area:volume ratio as cube size increases: decreases, process(es) to describe the movement of the blue dye into the cube: diffusion only
- F.percentage of the volume of the 3 cm cube penetrated by the dye: 87.5, change in surface area:volume ratio as cube size increases: increases, process(es) to describe the movement of the blue dye into the cube: diffusion and osmosis
- G.percentage of the volume of the 3 cm cube penetrated by the dye: 75.0, change in surface area:volume ratio as cube size increases: increases, process(es) to describe the movement of the blue dye into the cube: active transport and osmosis
- H.percentage of the volume of the 3 cm cube penetrated by the dye: 87.5, change in surface area:volume ratio as cube size increases: decreases, process(es) to describe the movement of the blue dye into the cube: active transport and osmosis
Answer: C
Question 57
1 markThe graph shows the rate of removal of sodium ions from a giant axon in a squid. Between 100 and 230 minutes, a reversible inhibitor of mitochondrial activity was present.
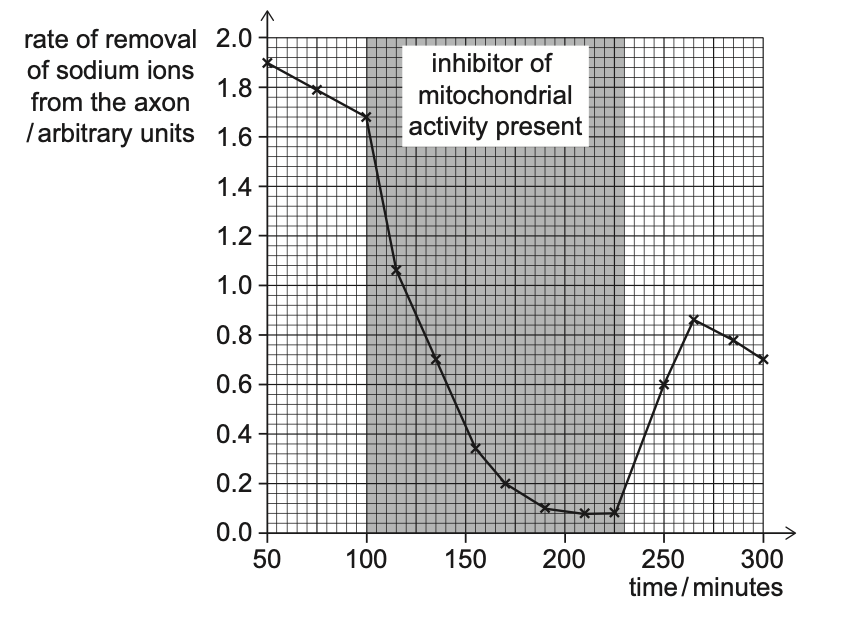
Which of the following statements is/are correct?
1 The removal of sodium ions across the cell surface membrane of the axon is an active process requiring ATP.
2 The concentration of sodium ions in the axon must increase after the inhibitor has been removed.
3 In the 50 minutes before the inhibitor was added, the rate of removal of sodium ions from the axon decreases by arbitrary units per minute.
Which of the following statements is/are correct?
1 The removal of sodium ions across the cell surface membrane of the axon is an active process requiring ATP.
2 The concentration of sodium ions in the axon must increase after the inhibitor has been removed.
3 In the 50 minutes before the inhibitor was added, the rate of removal of sodium ions from the axon decreases by arbitrary units per minute.
- A.none of them
- B.1 only
- C.2 only
- D.3 only
- E.1 and 2 only
- F.1 and 3 only
- G.2 and 3 only
- H.1, 2 and 3
Answer: F