Mapped to the ESAT specification
NSAA 2023 Biology Part Z
14 questions14 marksUpdated June 2026
Natural Sciences Admissions Assessment 2023 is one of the closest available past papers for the Engineering and Science Admissions Test. Below, all 14 questions are mapped to the ESAT topics they test, each with its answer. Sit it cold under exam timing, then work back through anything you missed using the solutions.
What this paper covers on the ESAT
Every question mapped to the Engineering and Science Admissions Test specification, so you know exactly which areas it tests.
Biology
- Enzymes (3)
- DNA (2)
- Inheritance (2)
- Movement across membranes (2)
- Cells (1)
- Gene technologies (1)
Questions and answers are free. Full step-by-step worked solutions unlock with a free account. Start practising.
Question 41
1 markImages of ribosomes from the cells of two different organisms were made using a transmission electron microscope (TEM) and a scanning electron microscope (SEM).
The image of the ribosome V using the TEM was 20 mm diameter at a magnification of × 1 000 000.
The image of the ribosome W using the SEM was 15 mm diameter at a magnification of × 500 000.
Which row about the ribosomes and the microscopes used to obtain images of them is correct?
The image of the ribosome V using the TEM was 20 mm diameter at a magnification of × 1 000 000.
The image of the ribosome W using the SEM was 15 mm diameter at a magnification of × 500 000.
Which row about the ribosomes and the microscopes used to obtain images of them is correct?
- A.actual diameter of ribosome: V = 30 nm, source of ribosome: eukaryotic cell, microscope that can resolve more detail: SEM, one function of ribosomes in this cell: to make proteins for the nuclear envelope
- B.actual diameter of ribosome: V = 30 µm, source of ribosome: eukaryotic cell, microscope that can resolve more detail: SEM, one function of ribosomes in this cell: to make components of flagellum
- C.actual diameter of ribosome: V = 20 nm, source of ribosome: prokaryotic cell, microscope that can resolve more detail: TEM, one function of ribosomes in this cell: to make proteins for the nuclear envelope
- D.actual diameter of ribosome: V = 20 nm, source of ribosome: prokaryotic cell, microscope that can resolve more detail: TEM, one function of ribosomes in this cell: to make components of flagellum
- E.actual diameter of ribosome: W = 30 µm, source of ribosome: eukaryotic cell, microscope that can resolve more detail: TEM, one function of ribosomes in this cell: to make components of flagellum
- F.actual diameter of ribosome: W = 30 nm, source of ribosome: eukaryotic cell, microscope that can resolve more detail: SEM, one function of ribosomes in this cell: to make proteins for the nuclear envelope
- G.actual diameter of ribosome: W = 30 µm, source of ribosome: prokaryotic cell, microscope that can resolve more detail: TEM, one function of ribosomes in this cell: to make components of flagellum
- H.actual diameter of ribosome: W = 20 nm, source of ribosome: prokaryotic cell, microscope that can resolve more detail: SEM, one function of ribosomes in this cell: to make proteins for the nuclear envelope
Answer: D
Question 42
1 markThe following two molecules join to form a disaccharide.
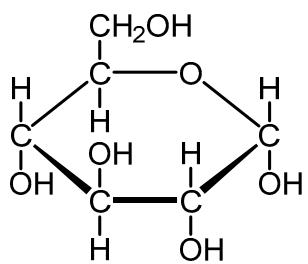
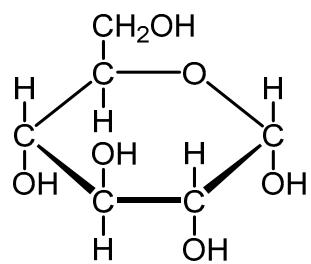
Which row is correct?
Which row is correct?
- A.reaction type when molecules join: condensation, disaccharide formed: maltose, number of hydroxyl groups in disaccharide formed: 8
- B.reaction type when molecules join: condensation, disaccharide formed: sucrose, number of hydroxyl groups in disaccharide formed: 8
- C.reaction type when molecules join: condensation, disaccharide formed: maltose, number of hydroxyl groups in disaccharide formed: 9
- D.reaction type when molecules join: condensation, disaccharide formed: sucrose, number of hydroxyl groups in disaccharide formed: 9
- E.reaction type when molecules join: hydrolysis, disaccharide formed: maltose, number of hydroxyl groups in disaccharide formed: 8
- F.reaction type when molecules join: hydrolysis, disaccharide formed: sucrose, number of hydroxyl groups in disaccharide formed: 8
- G.reaction type when molecules join: hydrolysis, disaccharide formed: maltose, number of hydroxyl groups in disaccharide formed: 9
- H.reaction type when molecules join: hydrolysis, disaccharide formed: sucrose, number of hydroxyl groups in disaccharide formed: 9
Answer: A
Question 43
1 markThe table gives some information about the inner membrane and outer membrane of mitochondria isolated from human liver cells.
| | mean surface area of the membrane / µm² | mean surface area of the membrane per 1 × 10⁻¹² g of protein / µm² |
| :--- | :--- | :--- |
| inner membrane | 6 | 450 |
| outer membrane | 2 | 150 |
Which of the following statements is/are correct?
1. The rate of diffusion of oxygen into a mitochondrion is affected by the thickness of the mitochondrial cell wall.
2. The mean total mass of protein in the inner membrane is equal to the mean total mass of protein in the outer membrane of the mitochondria.
3. All cellular respiration takes place in mitochondria.
| | mean surface area of the membrane / µm² | mean surface area of the membrane per 1 × 10⁻¹² g of protein / µm² |
| :--- | :--- | :--- |
| inner membrane | 6 | 450 |
| outer membrane | 2 | 150 |
Which of the following statements is/are correct?
1. The rate of diffusion of oxygen into a mitochondrion is affected by the thickness of the mitochondrial cell wall.
2. The mean total mass of protein in the inner membrane is equal to the mean total mass of protein in the outer membrane of the mitochondria.
3. All cellular respiration takes place in mitochondria.
- A.none of them
- B.1 only
- C.2 only
- D.3 only
- E.1 and 2 only
- F.1 and 3 only
- G.2 and 3 only
- H.1, 2 and 3
Answer: C
Question 44
1 markA research team has designed a cell-free miniature digestive system. The diagram outlines the system the scientists designed. A sample is introduced, and it is mixed with artificial digestive juices as it flows through the digestive system. The digested material, or chyme, flows out of the system.

The research team prepared a series of control experiments using artificial digestive juices. They adjusted the pH of buffers for the mouth, stomach, and intestines. Next, they added the enzymes to the saliva, gastric juice and mixture of duodenal juice and bile. Before introducing their artificial juices, they warmed them to 37 °C.
Pepsin and trypsin are both proteases.
Which row shows the correct combination of enzyme(s) and pH that will produce chyme that is most like chyme produced during healthy human digestion?
The research team prepared a series of control experiments using artificial digestive juices. They adjusted the pH of buffers for the mouth, stomach, and intestines. Next, they added the enzymes to the saliva, gastric juice and mixture of duodenal juice and bile. Before introducing their artificial juices, they warmed them to 37 °C.
Pepsin and trypsin are both proteases.
Which row shows the correct combination of enzyme(s) and pH that will produce chyme that is most like chyme produced during healthy human digestion?
- A.saliva: amylase + pepsin pH 4.3, gastric juice: pepsin pH 2.7, mixture of duodenal juice and bile: trypsin + lipase + amylase pH 10.3
- B.saliva: amylase pH 5.5, gastric juice: pepsin pH 6, mixture of duodenal juice and bile: trypsin + lipase only pH 6.5
- C.saliva: amylase pH 6.8, gastric juice: pepsin pH 1.3, mixture of duodenal juice and bile: trypsin + lipase + amylase pH 8.2
- D.saliva: amylase + pepsin pH 8.5, gastric juice: pepsin pH 2.5, mixture of duodenal juice and bile: trypsin + amylase only pH 7.5
- E.saliva: amylase pH 4.3, gastric juice: pepsin pH 5.5, mixture of duodenal juice and bile: trypsin + lipase + amylase pH 8.1
- F.saliva: amylase pH 7.2, gastric juice: pepsin pH 14, mixture of duodenal juice and bile: trypsin + lipase only pH 6.5
- G.saliva: amylase pH 6.9, gastric juice: pepsin pH 13, mixture of duodenal juice and bile: trypsin + lipase + amylase pH 8.2
Answer: C
Question 45
1 markA student investigated the penetration of a blue dye solution into agar cubes of differing size. Each cube was placed into a beaker of blue dye for the same period of time.
The cubes were then removed and cut into sections to measure the depth of penetration of the dye.
For a cube of side 20 mm, the depth of penetration of the dye was 4 mm.
Which row is correct for this cube?
The cubes were then removed and cut into sections to measure the depth of penetration of the dye.
For a cube of side 20 mm, the depth of penetration of the dye was 4 mm.
Which row is correct for this cube?
- A.total volume penetrated by the dye / mm³: , process by which the dye penetrated the agar: diffusion only
- B.total volume penetrated by the dye / mm³: , process by which the dye penetrated the agar: osmosis only
- C.total volume penetrated by the dye / mm³: , process by which the dye penetrated the agar: diffusion only
- D.total volume penetrated by the dye / mm³: , process by which the dye penetrated the agar: osmosis only
- E.total volume penetrated by the dye / mm³: , process by which the dye penetrated the agar: diffusion only
- F.total volume penetrated by the dye / mm³: , process by which the dye penetrated the agar: osmosis only
- G.total volume penetrated by the dye / mm³: , process by which the dye penetrated the agar: diffusion only
- H.total volume penetrated by the dye / mm³: , process by which the dye penetrated the agar: osmosis only
Answer: G
Question 46
1 markThe vegetation of the Galapagos islands contains 15 different species of a plant belonging to the group Scalesia.
The diagram below shows the relationship between the number of Scalesia species found and the relative age and size of the different Galapagos islands. Each island is represented by a different pair of letters.
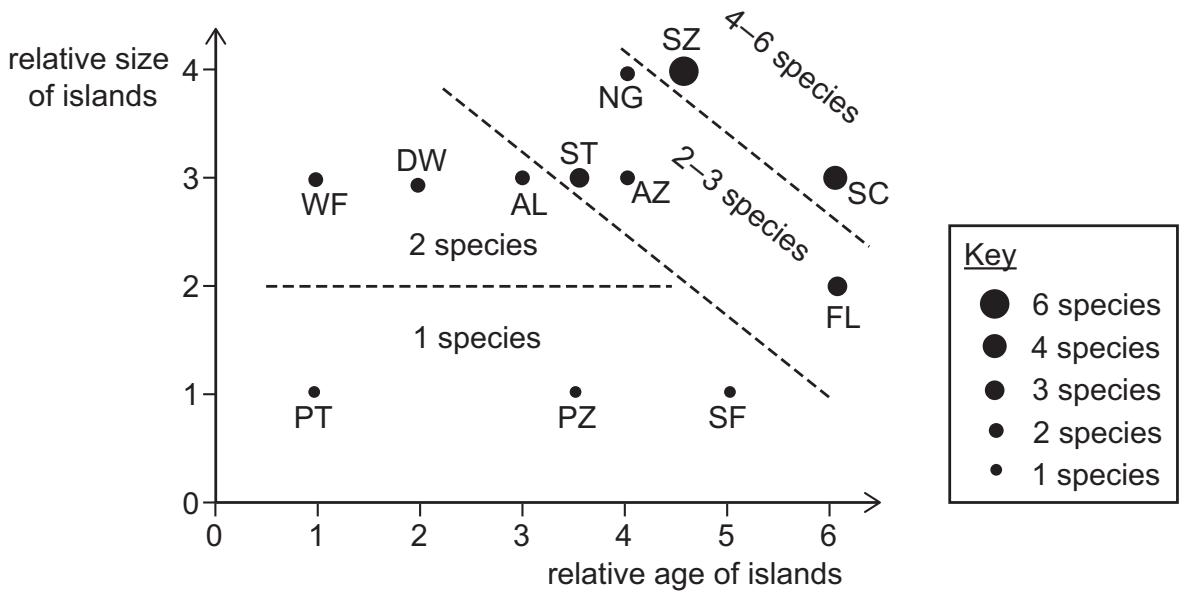
Which of the following statements is/are correct?
1. Older Galapagos islands always have more species.
2. Island SZ is similar in size to island NG but the number of Scalesia species is 200% larger.
3. The biotic and abiotic factors affecting Scalesia plants must be the same on PT, PZ and SF.
The diagram below shows the relationship between the number of Scalesia species found and the relative age and size of the different Galapagos islands. Each island is represented by a different pair of letters.
Which of the following statements is/are correct?
1. Older Galapagos islands always have more species.
2. Island SZ is similar in size to island NG but the number of Scalesia species is 200% larger.
3. The biotic and abiotic factors affecting Scalesia plants must be the same on PT, PZ and SF.
- A.none of them
- B.1 only
- C.2 only
- D.3 only
- E.1 and 2 only
- F.1 and 3 only
- G.2 and 3 only
- H.1, 2 and 3
Answer: C
Question 47
1 markThe diagram shows information about cell membranes.
Which option correctly identifies the following information?
• the solubility in water of the different parts of a cell membrane
• the effect of cholesterol on membrane fluidity as temperature decreases
• the units for the horizontal axis
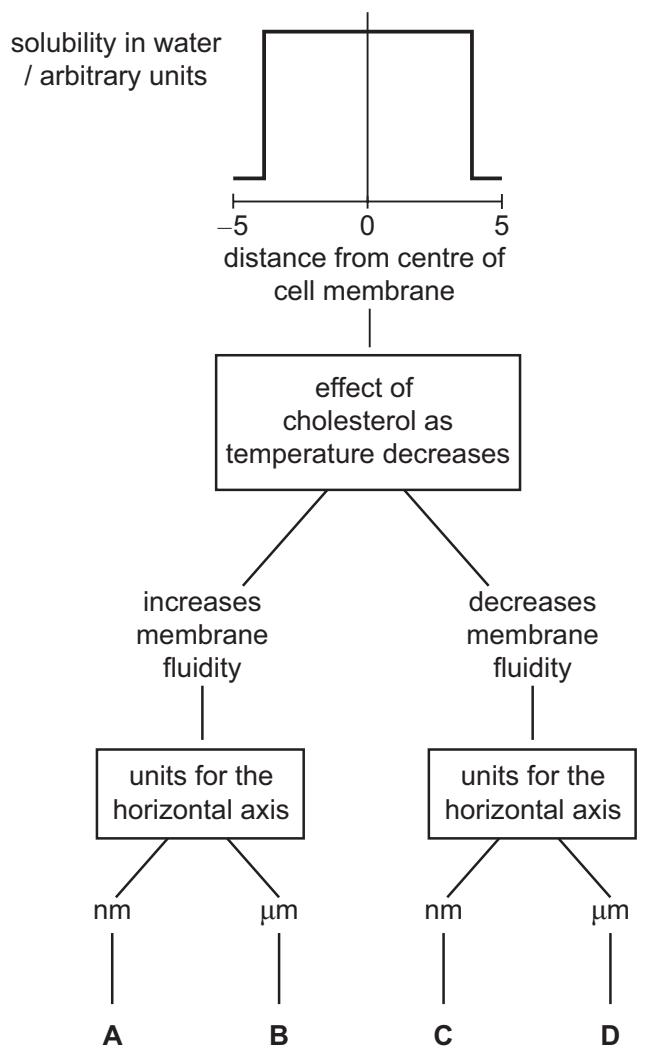
Which option correctly identifies the following information?
• the solubility in water of the different parts of a cell membrane
• the effect of cholesterol on membrane fluidity as temperature decreases
• the units for the horizontal axis
- A.Solubility graph 1, increases membrane fluidity, units nm
- B.Solubility graph 1, increases membrane fluidity, units µm
- C.Solubility graph 1, decreases membrane fluidity, units nm
- D.Solubility graph 1, decreases membrane fluidity, units µm
- E.Solubility graph 2, increases membrane fluidity, units nm
- F.Solubility graph 2, increases membrane fluidity, units µm
- G.Solubility graph 2, decreases membrane fluidity, units nm
- H.Solubility graph 2, decreases membrane fluidity, units µm
Answer: E
Question 48
1 markThe table shows the diameters of four different structures in the lungs of a healthy human: an alveolus, a bronchus, a bronchiole and the trachea (but not necessarily in this order).
| structure | diameter |
| :--- | :--- |
| 1 | 240 µm |
| 2 | 2.00 cm |
| 3 | 1.00 mm |
| 4 | 1.20 cm |
Which row is correct for these structures?
| structure | diameter |
| :--- | :--- |
| 1 | 240 µm |
| 2 | 2.00 cm |
| 3 | 1.00 mm |
| 4 | 1.20 cm |
Which row is correct for these structures?
- A.ratio of trachea diameter to bronchiole diameter: 200:1, a structure where gas exchange occurs: 3, a structure where cilia are present: 1, a structure where cartilage is present: 1
- B.ratio of trachea diameter to bronchiole diameter: 200:1, a structure where gas exchange occurs: 3, a structure where cilia are present: 2, a structure where cartilage is present: 2
- C.ratio of trachea diameter to bronchiole diameter: 20:1, a structure where gas exchange occurs: 1, a structure where cilia are present: 4, a structure where cartilage is present: 3
- D.ratio of trachea diameter to bronchiole diameter: 20:1, a structure where gas exchange occurs: 1, a structure where cilia are present: 4, a structure where cartilage is present: 4
- E.ratio of trachea diameter to bronchiole diameter: 20:1, a structure where gas exchange occurs: 3, a structure where cilia are present: 3, a structure where cartilage is present: 4
- F.ratio of trachea diameter to bronchiole diameter: 2:1, a structure where gas exchange occurs: 1, a structure where cilia are present: 2, a structure where cartilage is present: 4
- G.ratio of trachea diameter to bronchiole diameter: 2:1, a structure where gas exchange occurs: 1, a structure where cilia are present: 3, a structure where cartilage is present: 3
- H.ratio of trachea diameter to bronchiole diameter: 2:1, a structure where gas exchange occurs: 3, a structure where cilia are present: 3, a structure where cartilage is present: 2
Answer: D
Question 49
1 markScientists tested the effect of protein P on the survival of bacterial cell populations. They tested this with, and without, the presence of chemical Q. Chemical Q disrupts the formation of disulfide bonds. The results are shown on the chart.
All other factors were kept constant.
Assume that rates of cell division are constant and so do not affect population size.
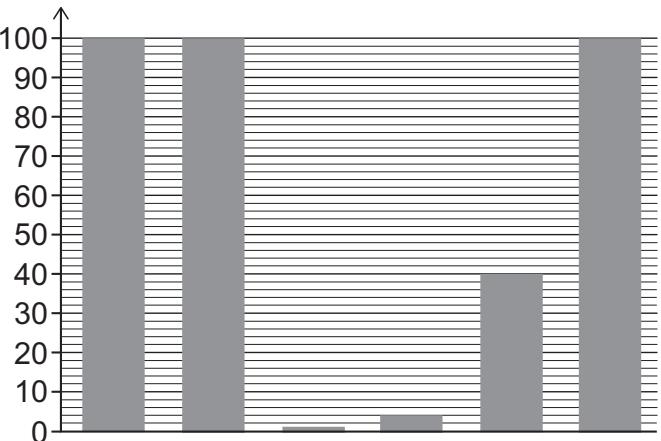
| experiment | 1 | 2 | 3 | 4 | 5 | 6 |
| :--- | :--- | :--- | :--- | :--- | :--- | :--- |
| concentration of protein P / µM | 0 | 0 | 5 | 5 | 5 | 5 |
| concentration of chemical Q / µM | 0 | 50 | 0 | 10 | 25 | 50 |
Which row in the table is correct?
All other factors were kept constant.
Assume that rates of cell division are constant and so do not affect population size.
| experiment | 1 | 2 | 3 | 4 | 5 | 6 |
| :--- | :--- | :--- | :--- | :--- | :--- | :--- |
| concentration of protein P / µM | 0 | 0 | 5 | 5 | 5 | 5 |
| concentration of chemical Q / µM | 0 | 50 | 0 | 10 | 25 | 50 |
Which row in the table is correct?
- A.protein P kills bacterial cells: yes, percentage increase in number of live bacteria remaining from experiment 4 to experiment 5: 900, which level of protein structure differs between P in experiments 3 and 6?: primary
- B.protein P kills bacterial cells: yes, percentage increase in number of live bacteria remaining from experiment 4 to experiment 5: 1000, which level of protein structure differs between P in experiments 3 and 6?: secondary
- C.protein P kills bacterial cells: yes, percentage increase in number of live bacteria remaining from experiment 4 to experiment 5: 900, which level of protein structure differs between P in experiments 3 and 6?: tertiary
- D.protein P kills bacterial cells: yes, percentage increase in number of live bacteria remaining from experiment 4 to experiment 5: 1000, which level of protein structure differs between P in experiments 3 and 6?: tertiary
- E.protein P kills bacterial cells: no, percentage increase in number of live bacteria remaining from experiment 4 to experiment 5: 900, which level of protein structure differs between P in experiments 3 and 6?: tertiary
- F.protein P kills bacterial cells: no, percentage increase in number of live bacteria remaining from experiment 4 to experiment 5: 1000, which level of protein structure differs between P in experiments 3 and 6?: primary
- G.protein P kills bacterial cells: no, percentage increase in number of live bacteria remaining from experiment 4 to experiment 5: 900, which level of protein structure differs between P in experiments 3 and 6?: secondary
- H.protein P kills bacterial cells: no, percentage increase in number of live bacteria remaining from experiment 4 to experiment 5: 1000, which level of protein structure differs between P in experiments 3 and 6?: tertiary
Answer: C
Question 50
1 markScientists found that water loss rates varied between plants of the same species, even when kept in identical conditions.
To investigate this, they used one species of plant to produce plant Q. This contained a mutation that deleted the whole of gene X. The scientists also produced a version of plant Q with an unmutated copy of gene X reinserted into the plant genome. They confirmed that the new copy of gene X allowed the plant to produce functional protein X from the gene.
The mutation in Q is shown in the table with the other plants used in the investigation.
| plant | description |
| :--- | :--- |
| P | contains unmutated version of gene X |
| Q | contains a deletion of the whole of gene X from plant DNA |
| R | plant Q with an unmutated copy of gene X reinserted into the genome |
[Other than the differences mentioned, all plants are genetically identical and grow normally. The rate of photosynthesis is the same in all three plants.]
The water use efficiencies of the plants were compared.
For a given rate of photosynthesis, plant water use efficiency is inversely proportional to the rate of transpiration.
The reactions were carried out at 21 °C in 10 hours of constant light intensity and 40% humidity. The plants were also supplied with a constant carbon dioxide concentration to ensure constant photosynthesis rates. These conditions were the same for all plants.
The results of the experiment are shown in the chart.
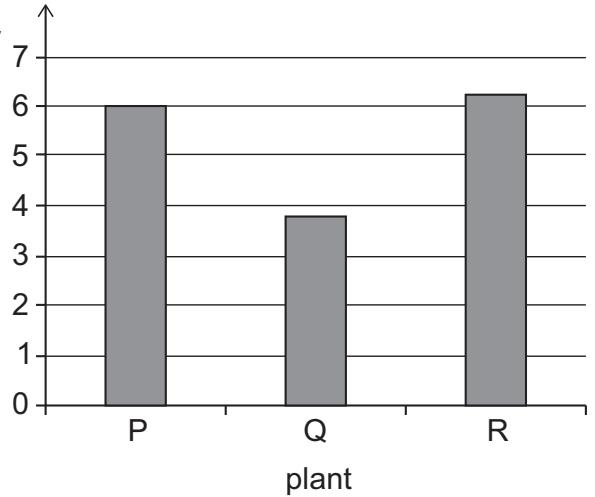
Which row is correct?
To investigate this, they used one species of plant to produce plant Q. This contained a mutation that deleted the whole of gene X. The scientists also produced a version of plant Q with an unmutated copy of gene X reinserted into the plant genome. They confirmed that the new copy of gene X allowed the plant to produce functional protein X from the gene.
The mutation in Q is shown in the table with the other plants used in the investigation.
| plant | description |
| :--- | :--- |
| P | contains unmutated version of gene X |
| Q | contains a deletion of the whole of gene X from plant DNA |
| R | plant Q with an unmutated copy of gene X reinserted into the genome |
[Other than the differences mentioned, all plants are genetically identical and grow normally. The rate of photosynthesis is the same in all three plants.]
The water use efficiencies of the plants were compared.
For a given rate of photosynthesis, plant water use efficiency is inversely proportional to the rate of transpiration.
The reactions were carried out at 21 °C in 10 hours of constant light intensity and 40% humidity. The plants were also supplied with a constant carbon dioxide concentration to ensure constant photosynthesis rates. These conditions were the same for all plants.
The results of the experiment are shown in the chart.
Which row is correct?
- A.effect of protein X on transpiration rates: decrease, effect of increasing humidity on the water use efficiency of plant Q: decreases
- B.effect of protein X on transpiration rates: decrease, effect of increasing humidity on the water use efficiency of plant Q: stays the same
- C.effect of protein X on transpiration rates: decrease, effect of increasing humidity on the water use efficiency of plant Q: increases
- D.effect of protein X on transpiration rates: increase, effect of increasing humidity on the water use efficiency of plant Q: decreases
- E.effect of protein X on transpiration rates: increase, effect of increasing humidity on the water use efficiency of plant Q: stays the same
- F.effect of protein X on transpiration rates: increase, effect of increasing humidity on the water use efficiency of plant Q: increases
Answer: C
Question 51
1 markA student identified the position of xylem vessels in the root and stem of a plant.
Two different types of potometer, P and Q, were used to study transpiration.
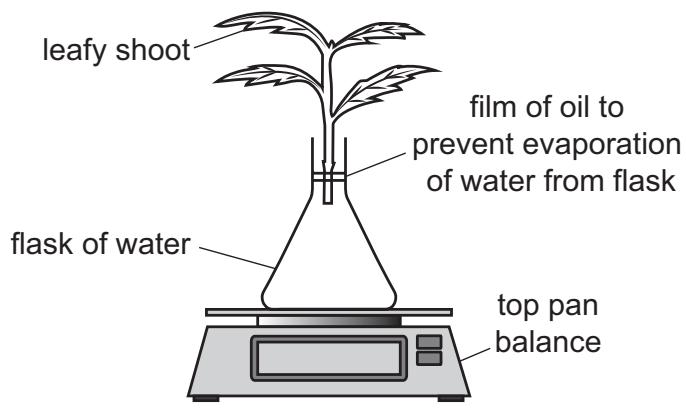
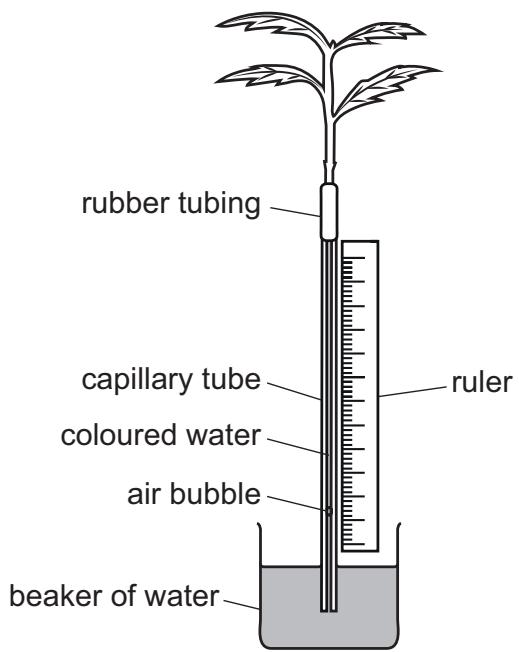
When the plant shoot was set up in potometer P, it lost 11.55 g of water in 1 hour.
The same shoot was then set up in potometer Q, which had a capillary of internal diameter 7 mm.
All other conditions were the same for both pieces of apparatus.
Assume that water lost by the shoot is the same as that taken up.
1 g of water has a volume of 1 cm³.
The table shows possible distances that the air bubble would travel up the capillary tube in one minute and diagrams of a plant stem and plant root.
Which row is correct? (Approximate as )
Two different types of potometer, P and Q, were used to study transpiration.
When the plant shoot was set up in potometer P, it lost 11.55 g of water in 1 hour.
The same shoot was then set up in potometer Q, which had a capillary of internal diameter 7 mm.
All other conditions were the same for both pieces of apparatus.
Assume that water lost by the shoot is the same as that taken up.
1 g of water has a volume of 1 cm³.
The table shows possible distances that the air bubble would travel up the capillary tube in one minute and diagrams of a plant stem and plant root.
Which row is correct? (Approximate as )
- A.distance travelled by bubble in one minute / mm: 0.50, position of xylem in stem: [diagram of scattered vascular bundles], position of xylem in root: [diagram of central star-shaped xylem]
- B.distance travelled by bubble in one minute / mm: 0.50, position of xylem in stem: [diagram of central star-shaped xylem], position of xylem in root: [diagram of scattered vascular bundles]
- C.distance travelled by bubble in one minute / mm: 1.25, position of xylem in stem: [diagram of scattered vascular bundles], position of xylem in root: [diagram of central star-shaped xylem]
- D.distance travelled by bubble in one minute / mm: 1.25, position of xylem in stem: [diagram of central star-shaped xylem], position of xylem in root: [diagram of scattered vascular bundles]
- E.distance travelled by bubble in one minute / mm: 5.00, position of xylem in stem: [diagram of scattered vascular bundles], position of xylem in root: [diagram of central star-shaped xylem]
- F.distance travelled by bubble in one minute / mm: 5.00, position of xylem in stem: [diagram of central star-shaped xylem], position of xylem in root: [diagram of scattered vascular bundles]
- G.distance travelled by bubble in one minute / mm: 8.75, position of xylem in stem: [diagram of scattered vascular bundles], position of xylem in root: [diagram of central star-shaped xylem]
- H.distance travelled by bubble in one minute / mm: 8.75, position of xylem in stem: [diagram of central star-shaped xylem], position of xylem in root: [diagram of scattered vascular bundles]
Answer: F
Question 52
1 markDNA replication is an enzyme-catalysed reaction. Experiments were performed at different temperatures using double-stranded DNA (dsDNA), with different percentages of guanine and cytosine base pairs (GC), as the substrate.
The graph shows how the relative rates of DNA replication vary with both temperature and the base composition of the substrate. The enzyme is thermally stable at all temperatures in the range.
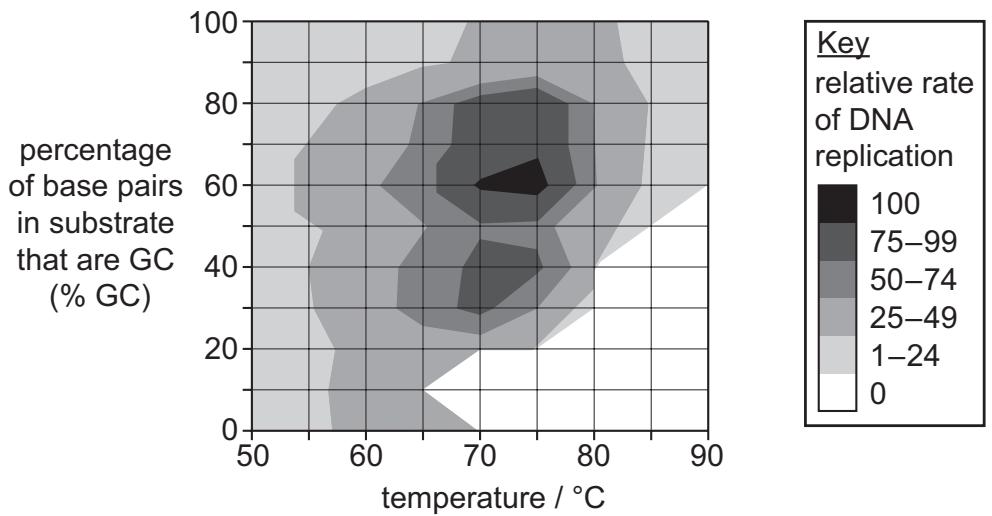
The temperature coefficient () can be used to analyse the effect of increasing temperature on the rate of DNA replication. can be calculated as follows:
For the temperatures investigated, which of the following statements is/are correct?
1. can be zero if the substrate has only adenine and thymine base pairs.
2. is always greater than one for substrates with 60% GC.
3. At any single temperature below the optimum for this enzyme, is always less for a substrate with 60% GC than for a substrate with 100% GC.
The graph shows how the relative rates of DNA replication vary with both temperature and the base composition of the substrate. The enzyme is thermally stable at all temperatures in the range.
The temperature coefficient () can be used to analyse the effect of increasing temperature on the rate of DNA replication. can be calculated as follows:
For the temperatures investigated, which of the following statements is/are correct?
1. can be zero if the substrate has only adenine and thymine base pairs.
2. is always greater than one for substrates with 60% GC.
3. At any single temperature below the optimum for this enzyme, is always less for a substrate with 60% GC than for a substrate with 100% GC.
- A.none of them
- B.1 only
- C.2 only
- D.3 only
- E.1 and 2 only
- F.1 and 3 only
- G.2 and 3 only
- H.1, 2 and 3
Answer: B
Question 53
1 markThe affinity of haemoglobin for oxygen can be expressed as a p50 value. This represents the partial pressure of oxygen (in mmHg), , at which the haemoglobin is 50% saturated with oxygen.
In healthy humans, there is some variation in the p50 value between individuals, between sexes and with different fitness levels.
Scientists measured the affinity of haemoglobin in men and women volunteers. They separated the volunteers into groups of trained and untrained individuals. A trained individual runs for a minimum of one hour, three times a week and has done so for at least one year.
The results are shown in the table.
| group of individuals tested | mean p50 value for this group in the study / mmHg |
| :--- | :--- |
| untrained women | 28.7 |
| trained women | 29.1 |
| untrained men | 28.2 |
| trained men | 27.8 |
Which row of the table is correct?
In healthy humans, there is some variation in the p50 value between individuals, between sexes and with different fitness levels.
Scientists measured the affinity of haemoglobin in men and women volunteers. They separated the volunteers into groups of trained and untrained individuals. A trained individual runs for a minimum of one hour, three times a week and has done so for at least one year.
The results are shown in the table.
| group of individuals tested | mean p50 value for this group in the study / mmHg |
| :--- | :--- |
| untrained women | 28.7 |
| trained women | 29.1 |
| untrained men | 28.2 |
| trained men | 27.8 |
Which row of the table is correct?
- A.group with haemoglobin that has the highest mean affinity for oxygen: trained men, expected change in p50 value in muscles whilst running: increase
- B.group with haemoglobin that has the highest mean affinity for oxygen: trained men, expected change in p50 value in muscles whilst running: decrease
- C.group with haemoglobin that has the highest mean affinity for oxygen: trained women, expected change in p50 value in muscles whilst running: increase
- D.group with haemoglobin that has the highest mean affinity for oxygen: trained women, expected change in p50 value in muscles whilst running: decrease
- E.group with haemoglobin that has the highest mean affinity for oxygen: untrained men, expected change in p50 value in muscles whilst running: increase
- F.group with haemoglobin that has the highest mean affinity for oxygen: untrained men, expected change in p50 value in muscles whilst running: decrease
- G.group with haemoglobin that has the highest mean affinity for oxygen: untrained women, expected change in p50 value in muscles whilst running: increase
- H.group with haemoglobin that has the highest mean affinity for oxygen: untrained women, expected change in p50 value in muscles whilst running: decrease
Answer: A
Question 54
1 markLipids are carried in the blood in combination with protein (lipoproteins). The enzyme lipoprotein lipase (LPL) is produced by endothelial cells lining the capillaries in muscle, heart and fatty tissues. This extracellular enzyme attaches to the capillary wall so that it is in contact with the blood.
Mutations in the gene for LPL can result in LPL deficiency and the accumulation of triglycerides in blood.
LPL deficiency is a recessive genetic condition and the gene coding for LPL is not carried on a sex chromosome.
One common mutation leads to the amino acid glycine being replaced by the amino acid glutamic acid at one position in the enzyme. This mutation is written as Gly188Glu.
Which of the statements is/are correct?
1. In healthy humans, the LPL gene is transcribed and translated in the nucleus of endothelial cells and then the protein is packaged by the Golgi apparatus for secretion from the cells.
2. In humans who are homozygous for the LPL mutation Gly188Glu, the mutated LPL gene is transcribed but not translated.
3. With parents who are both heterozygous for the LPL gene, the probability of a child without LPL deficiency being heterozygous is 50%.
Mutations in the gene for LPL can result in LPL deficiency and the accumulation of triglycerides in blood.
LPL deficiency is a recessive genetic condition and the gene coding for LPL is not carried on a sex chromosome.
One common mutation leads to the amino acid glycine being replaced by the amino acid glutamic acid at one position in the enzyme. This mutation is written as Gly188Glu.
Which of the statements is/are correct?
1. In healthy humans, the LPL gene is transcribed and translated in the nucleus of endothelial cells and then the protein is packaged by the Golgi apparatus for secretion from the cells.
2. In humans who are homozygous for the LPL mutation Gly188Glu, the mutated LPL gene is transcribed but not translated.
3. With parents who are both heterozygous for the LPL gene, the probability of a child without LPL deficiency being heterozygous is 50%.
- A.none of them
- B.1 only
- C.2 only
- D.3 only
- E.1 and 2 only
- F.1 and 3 only
- G.2 and 3 only
- H.1, 2 and 3
Answer: A