Probability and Set Enumeration for the ESAT
Updated July 2026
Systematic enumeration is the foundation of probability for the ESAT. By using tables, grids, Venn diagrams, and tree diagrams, students can organise possible outcomes to calculate probabilities accurately. Mastering these visual tools ensures that no possible outcome is overlooked in complex multi-stage experiments.
Enumeration is the systematic listing of all possible outcomes in an experiment. Using structured representations such as diagrams and tables allows for the identification of specific subsets and the calculation of their probabilities.
In probability questions, it is often essential to list the possible outcomes of an experiment systematically. Organising information using tables, grids, Venn diagrams, and tree diagrams allows you to identify specific outcomes and calculate their probabilities without missing any possibilities.
Listing sets
A set is a collection of distinct objects or numbers. To list a set, you group the members within curly brackets. For example, the set of all vowels is {a, e, i, o, u}, and the set containing the first 10 prime numbers is {2, 3, 5, 7, 11, 13, 17, 19, 23, 29}.
When working with multiples, ensure you list the correct number of items. For instance, the first 10 multiples of 6 are {6, 12, 18, 24, 30, 36, 42, 48, 54, 60}, and the first 10 multiples of 8 are {8, 16, 24, 32, 40, 48, 56, 64, 72, 80}.
Listing combinations of sets
You may be asked to find members that belong to multiple sets at once. Consider two sets:
- Set A: The first 10 prime numbers {2, 3, 5, 7, 11, 13, 17, 19, 23, 29}.
- Set B: Odd numbers from 1 to 20 {1, 3, 5, 7, 9, 11, 13, 15, 17, 19}.
The members belonging to both Set A and Set B are numbers that are both prime and an odd number between 1 and 20. By comparing the lists, we find these are {3, 5, 7, 11, 13, 17, 19}.
Similarly, if Set A is the first 10 multiples of 6 and Set B is the first 10 multiples of 8, the numbers that appear in both lists are 24 and 48.
Using grids
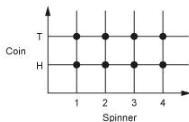
A grid can be used to represent all possible outcomes of two events. Dots or markers represent specific outcomes, allowing for easy identification of relevant points.
For example, if an unbiased coin is flipped and a four sided spinner numbered 1 to 4 is spun, the possible outcomes are shown in the grid below:
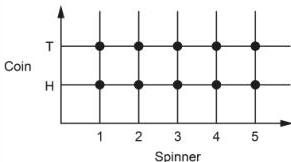
Consider a similar experiment where an unbiased coin is flipped and a fair five sided spinner (1 to 5) is spun. We can represent this with axes where one axis shows Head (H) or Tail (T) and the other shows numbers 1 to 5:
To find the probability of getting a head or an odd number (or both), we highlight the outcomes on the grid that satisfy these conditions:
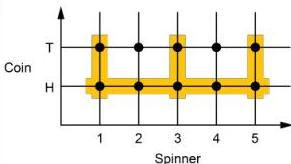
There are 10 total outcomes. We count 8 outcomes that are either a head, an odd number, or both. Thus, .
To find the probability of a tail but not an odd number, we locate those specific points:
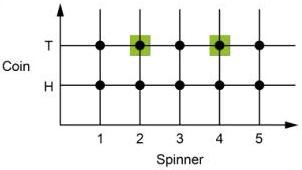
There are 2 outcomes (Tail with 2, Tail with 4). .
Using tables
Tables, often called sample space or possibility space diagrams, are useful for recorded pairs of scores, such as rolling two dice. Below is a sample space for two unbiased six sided dice:
| 1 | 2 | 3 | 4 | 5 | 6 | |
|---|---|---|---|---|---|---|
| 1 | (1,1) | (1,2) | (1,3) | (1,4) | (1,5) | (1,6) |
| 2 | (2,1) | (2,2) | (2,3) | (2,4) | (2,5) | (2,6) |
| 3 | (3,1) | (3,2) | (3,3) | (3,4) | (3,5) | (3,6) |
| 4 | (4,1) | (4,2) | (4,3) | (4,4) | (4,5) | (4,6) |
| 5 | (5,1) | (5,2) | (5,3) | (5,4) | (5,5) | (5,6) |
| 6 | (6,1) | (6,2) | (6,3) | (6,4) | (6,5) | (6,6) |
If we use two four sided dice (1 to 4), the table would look like this:
| 1 | 2 | 3 | 4 | |
|---|---|---|---|---|
| 1 | (1,1) | (1,2) | (1,3) | (1,4) |
| 2 | (2,1) | (2,2) | (2,3) | (2,4) |
| 3 | (3,1) | (3,2) | (3,3) | (3,4) |
| 4 | (4,1) | (4,2) | (4,3) | (4,4) |
From this table:
- The outcomes with the same score are (1,1), (2,2), (3,3), (4,4). There are 4 possibilities.
- Total scores of 5 or more are found by adding the pairs. There are 10 such pairings: (1,4), (2,3), (2,4), (3,2), (3,3), (3,4), (4,1), (4,2), (4,3), (4,4).
- Total scores of 1 are impossible, as the minimum score is . There are 0 such outcomes.
Using Venn diagrams
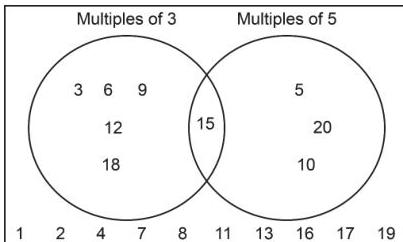
A Venn diagram uses circles to show set membership. Members in the overlap belong to both sets. Members outside the circles belong to neither set. Consider integers from 1 to 20 for multiples of 3 and 5:
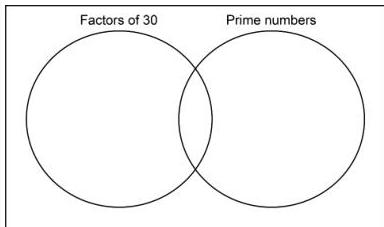
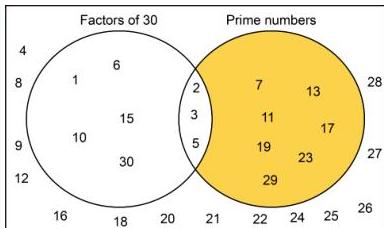
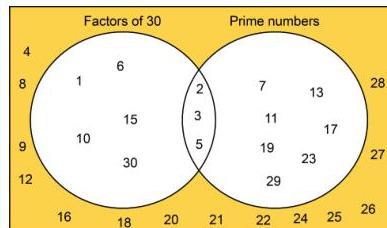
For integers from 1 to 30, consider the sets of Factors of 30 and Prime numbers:
By placing each number correctly, we get:
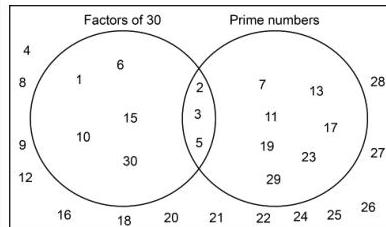
- Factors of 30: 1, 2, 3, 5, 6, 10, 15, 30. There are 8 such integers.
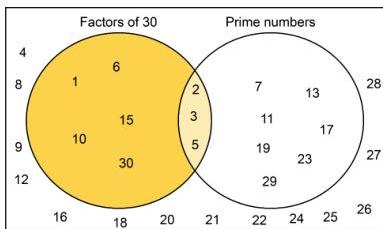
- Factors and Primes: These are in the overlap (2, 3, 5). There are 3 such integers.
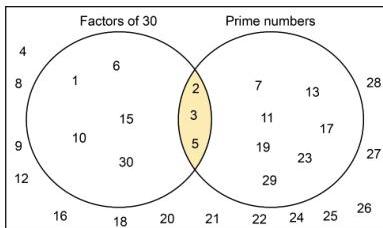
- .
- (numbers 7, 11, 13, 17, 19, 23, 29).
- (the numbers outside both circles).
Complex problems may use three sets. Consider odd numbers from 0 to 50 categorised by being a square number, a multiple of 3, or a multiple of 5:
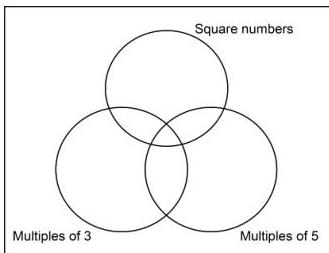
After sorting all odd numbers, the diagram is populated as follows:
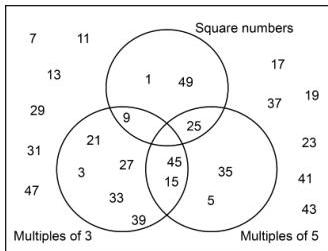
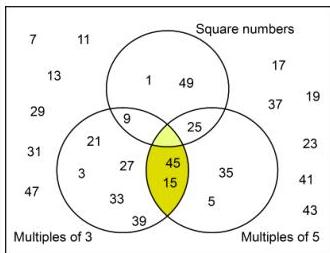
- Multiples of 3 and 5: These are 15 and 45 (2 numbers).
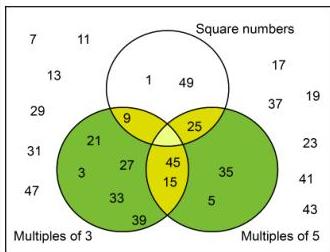
- Multiples of 3 or 5: These are any values in those two circles (11 numbers).
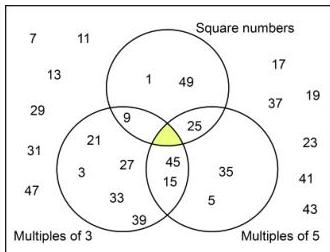
- Probability of (Square and Multiple of 3 and Multiple of 5): This is the central overlap. There are no such numbers between 0 and 50, so .
- Probability of a Square: The top circle contains 1, 9, 25, 49. Total odd numbers 0 to 50 is 25. .
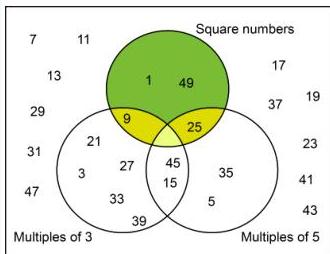
- Probability of a Square but not 3 or 5: These are 1 and 49. .
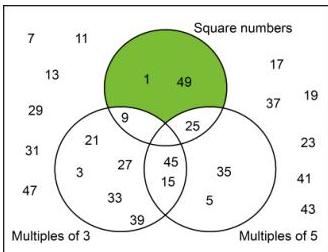
- Probability of a Square but not 3: These are 1, 25, 49. .
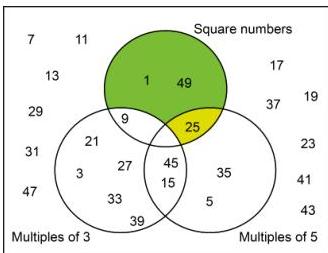
- Probability of not Square, not Multiple of 3, and not Multiple of 5: The 12 numbers outside all circles. .
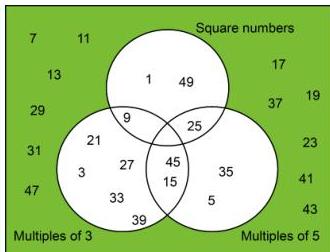
The first odd number that would occupy the central region (all three sets) is .
Using tree diagrams
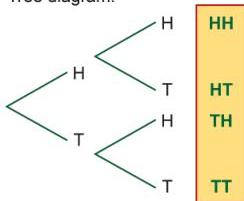
A tree diagram lists a set of outcomes for sequences of events. For two coin flips, the branches show Head (H) or Tail (T) twice, resulting in the set {HH, HT, TH, TT}:
Consider a three sided spinner with colours Red (R), Yellow (Y), and Blue (B). The tree diagram for two spins shows 9 outcomes:
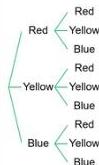
Outcomes: RR, RY, RB, YR, YY, YB, BR, BY, BB.
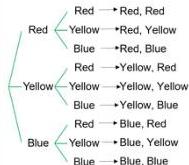
- (RR, YY, BB).
- (YB, BY).
- (RR, RB, BR, BB).
- (RR, RY, RB, YR, BR).
For a coin tossed three times, the tree diagram expands to 8 outcomes:
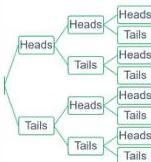
Outcomes: HHH, HHT, HTH, HTT, THH, THT, TTH, TTT.
- .
- (HHT, HTH, THH).
- .
Key takeaways
- Grids and tables are best for two independent events, while tree diagrams are superior for sequences of events.
- In a Venn diagram, the region outside the circles represents elements that belong to the universal set but none of the specific subsets.
- The total number of outcomes in a tree diagram is found by multiplying the number of choices at each branch level.
- The 'at least' probability is often most easily calculated by subtracting the probability of the unwanted outcome from 1.
Always count the total number of outcomes first. In a table or grid, this is the total number of cells or dots. In a tree diagram, it is the total number of final branch tips.
When using a Venn diagram to count totals, remember that the numbers in the overlap are already included in the totals for each individual circle. Do not count them twice when finding the total number of items in 'Set A or Set B'.
The systematic enumeration of sets is the basis for the addition and multiplication rules of probability. For example, the 'overlap' in a Venn diagram represents the logical 'AND', which corresponds to multiplying probabilities for independent events.
Frequently asked questions
When should I use a grid instead of a tree diagram?
Grids are useful for two simultaneous or independent events with many numeric outcomes (like rolling two dice). Tree diagrams are better for sequences of events or when the second event depends on the outcome of the first.
Is it necessary to use formal set notation like intersection or union?
No, for the ESAT, you are not expected to know formal set theory notation. You should use descriptive language like 'both', 'either', or 'neither'.
What does the area outside the circles in a Venn diagram represent?
It represents the members of the data set that do not satisfy any of the conditions defined by the circles. For example, in a diagram of prime numbers and even numbers, the number 9 would be placed in the outside area.
How do I calculate 'at least one' head in three coin flips without a tree diagram?
While a tree diagram is systematic, you can use the complement rule: . Since the only way to get no heads is TTT (), the probability of at least one is .