Probability Rules and Conditional Outcomes for the ESAT
Updated July 2026
Master the essential rules of probability for the ESAT Mathematics 1 paper. This guide explains when to add or multiply probabilities, how to handle independent and dependent events, and how to calculate conditional probabilities using tree diagrams, Venn diagrams, and two-way tables.
Probability operations are determined by event relationships: add for mutually exclusive 'or' events, multiply for independent 'and' events, and adjust probabilities for dependent or conditional scenarios.
Addition of Probabilities
Events are defined as mutually exclusive if it is impossible for more than one of them to occur at the same time. For two events and that are mutually exclusive, the probability of either or occurring is the sum of their individual probabilities:
If two events are not mutually exclusive, they can happen simultaneously. In this case, there is an overlap that must be accounted for to avoid double counting. The probability is calculated as:
Example: Mutually Exclusive Events
Alice has a spinner. The probability of landing on a square number is , and the probability of landing on a prime number is . What is the probability that the spinner lands on a prime number or a square number?
- Identify if the events are mutually exclusive. Prime numbers (2, 3, 5, 7...) and square numbers (1, 4, 9, 16...) do not overlap. All square numbers have their square root as a factor, meaning they cannot meet the requirement of having exactly two factors to be prime. Therefore, they are mutually exclusive.
- Apply the addition rule: .
Example: Testing for Mutual Exclusivity
The probability of event is , and event is . The probability that neither occurs is . Are and mutually exclusive?
- Find : .
- Use the general addition formula: .
- Calculate the overlap: .
- Conclusion: Since , the events are not mutually exclusive.
Multiplication of Probabilities
Two events, and , are independent if the occurrence of does not change the probability of occurring. For independent events, the probability of both occurring is the product of their individual probabilities:
Example: Independent Machines
The probability of machine breaking down is , and machine is . One breakdown does not affect the other.
- Both break down: .
- Neither breaks down: .
Tree Diagrams for Independent Events
Tree diagrams help visualise combined events. When events are independent, the probabilities on the second set of branches are identical regardless of the first outcome.
Example: School Sports
A school football team has and . A cricket team has and . We first find the missing 'lose' probabilities: , and .
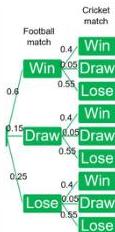
- Both teams win: .
- Both teams lose: .
- At least one team wins: This includes all branches where football wins () plus the cases where football does not win but cricket wins (). Total .
- Neither team draws: .
Example: Counters with Replacement
A bag has 7 red and 3 blue counters. A counter is picked, returned, then a second is picked. Because the counter is returned, the events are independent.
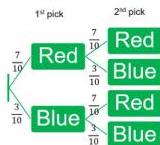
- Both red: .
- At least one blue: .
- One of each colour: .
Tree Diagrams for Dependent Events
When outcomes are dependent, the first event changes the probability of the second. This often occurs when items are not replaced.
Example: Counters without Replacement
Using the same bag (7 red, 3 blue), but the first counter is not replaced.
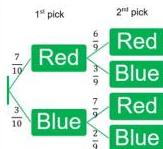
- Both red: The first is . If red was picked, 6 red remain out of 9 total. Probability .
- At least one blue: .
- One of each: .
Conditional Probability
Conditional probability is the probability of event occurring known that event has already occurred. If and are independent, . If they are dependent, these probabilities differ.
Two-Way Tables
Tables are useful for calculating conditional probabilities by restricting the sample space to a specific row or column.
| Production Line | Warehouse | Office | Total | |
|---|---|---|---|---|
| Drive | 35 | 37 | 21 | 93 |
| Not Drive | 18 | 20 | 19 | 57 |
| Total | 53 | 57 | 40 | 150 |
- P(Drive given Warehouse): Look only at the warehouse column. .
- P(Office given Drive): Look only at the drive row. .
Venn Diagrams
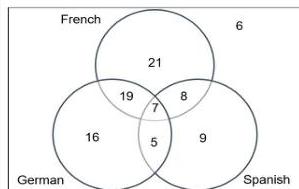
- P(studies one language only): .
- P(does not study German): .
- P(studies French given they study German): Limit to the German circle (). French students within that group are . Probability .
Tree Diagrams for Conditional Probability
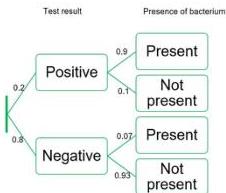
To find the probability that the bacterium is present given a positive test result, we use the formula:
.
(to 3 decimal places).
Key takeaways
- Events are mutually exclusive if , allowing probabilities to be added directly.
- Events are independent if , meaning one does not affect the other.
- In tree diagrams, multiply along branches to find the probability of a specific outcome sequence.
- Conditional probability is calculated by dividing the probability of both events occurring by the probability of the condition ().
- For dependent events (like picking without replacement), update the probabilities on subsequent tree branches.
Always check that the probabilities on any set of branches originating from a single point sum to 1. If they do not, you have missed an outcome or made a calculation error.
Be careful with the wording of replacement. If an item is not replaced, the total number of items decreases for the second event, which is a common place to lose marks.
The concept of conditional probability is the foundation of Bayes' Theorem, which allows us to reverse conditional probabilities, such as finding the likelihood of a disease given a positive test result.
Frequently asked questions
How can I tell if I should add or multiply two probabilities?
Use the addition rule when you want to find the probability of one event OR another occurring. Use the multiplication rule when you want to find the probability of one event AND another occurring.
What is the easiest way to solve at least one questions?
It is often simpler to calculate the probability of the event never occurring and subtract this from 1. For example, .
How do tree diagrams change if events are dependent?
In dependent events, the denominator or numerator of the second stage probabilities will change based on the outcome of the first stage. For example, if you pick a red counter and do not replace it, the number of red counters and the total number of counters both decrease for the next pick.
Does always equal ?
No. is the probability of given has happened, while is the probability of given has happened. These usually have different denominators based on different conditions.