Frequency Tables and Frequency Trees in Probability
Updated July 2026
This section explains how to record and analyse the outcomes of probability experiments using frequency tables and frequency trees. These tools are vital for estimating probabilities based on observed data and for calculating missing subsets within a larger population, which are key skills for the ESAT Mathematics 1 paper.
Frequency tables and frequency trees are methods of organising data from experiments to calculate relative frequencies, where the relative frequency of an event is defined as the frequency of that event divided by the total number of trials.
Analysing Experimental Outcomes with Tables
When we conduct a probability experiment, we can record the results in a frequency table to evaluate whether an outcome is likely or if a device, such as a spinner, is biased. The relative frequency serves as an estimate for the actual probability of an event.
Consider a spinner with three sections: red, blue, and yellow. To test if the spinner is biased, Matthew spins it 50 times and records the results in the following table:
| Colour | Red | Blue | Yellow | Total |
|---|---|---|---|---|
| Frequency | 19 | 15 | 16 | 50 |
To estimate the probability of the spinner landing on each colour, we calculate the relative frequency by dividing the frequency of each colour by the total number of spins, which is 50:
- The probability of landing on Red is , which is .
- The probability of landing on Blue is , which is .
- The probability of landing on Yellow is , which is .
By converting these to decimals, we can easily compare them. Because the relative frequencies (, , and ) are all very similar, we conclude that there is insufficient evidence to suggest the spinner is biased.
Using Frequency Trees to Organise Data
Frequency trees are a helpful way to visualize how a total frequency is split into different categories and sub-categories. They are particularly useful for solving problems where some data points are missing.
Consider an example where 50 students are taking their driving test. We are given the following information:
- 18 students took 15 or more hours of lessons.
- 11 of the students who took 15 or more hours passed first time.
- 27 students in total did not pass first time.
Our goal is to find out how many students took less than 15 hours of lessons and passed first time. We begin by setting up the structure of the frequency tree.
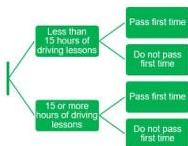
Next, we add the frequencies we know directly from the question onto the branches.
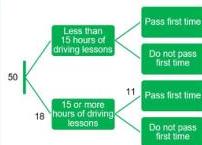
To complete the tree, we use subtraction based on the relationships between the nodes:
- Find the number of students with less than 15 hours of lessons: Since there are 50 students in total and 18 had 15 or more hours, the remainder must have had less than 15 hours. .
- Find the number of students with 15 or more hours who did not pass: There were 18 students in this group, and 11 passed. Therefore, students did not pass.
- Find the number of students with less than 15 hours who did not pass: We know 27 students in total did not pass. Since 7 of these students were in the 15 or more hours group, the rest must be in the less than 15 hours group. .
- Find the final answer: There were 32 students who took less than 15 hours of lessons. If 20 of them did not pass, then the number who did pass is .
The completed frequency tree looks like this:
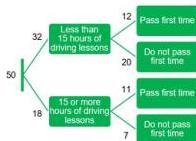
From the tree, we can clearly see that 12 students took less than 15 hours of lessons and passed their test first time.
Key takeaways
- Relative frequency is calculated by dividing the frequency of a specific outcome by the total number of trials.
- A device is considered biased only if the relative frequencies of its outcomes differ significantly from what is theoretically expected.
- In a frequency tree, the sum of the frequencies on the branches coming from a single node must always equal the frequency at that node.
- Frequency trees allow you to determine missing information by working backwards from totals or across parallel branches.
When filling out a frequency tree, always look for the branch where you have two out of three related values first. This allows you to perform a simple subtraction to find the third value and move further into the tree.
Do not confuse frequency (the count of items) with probability (the fraction or decimal). Frequency trees use whole numbers representing the count, not fractions or percentages.
Frequency trees are a concrete representation of set theory. For example, the branching for '15 or more hours' versus 'less than 15 hours' represents a set and its complement, ensuring that the union of the two branches covers the entire population.
Frequently asked questions
What is the difference between relative frequency and theoretical probability?
Relative frequency is based on actual observations or experimental data, whereas theoretical probability is based on the assumption of what should happen in a perfectly fair scenario, such as a chance for any number on a fair die.
Can relative frequency be greater than 1?
No. Since the frequency of a specific outcome cannot exceed the total number of trials, the ratio will always be between 0 and 1 inclusive.
In a frequency tree, which node represents the sample size?
The sample size, or total frequency, is represented by the very first node on the far left of the tree before any branching occurs.
How do you check if your frequency tree is correct?
You can check your tree by ensuring that all the final branch frequencies (the leaf nodes) sum up to equal the initial total frequency at the start of the tree.