Atomic Structure and Relative Atomic Mass
Updated July 2026
Relative atomic mass, , is a weighted average that accounts for the natural abundance of an element's isotopes. For the ESAT, you must define isotopes, interpret mass spectra data, and calculate using isotopic mass and abundance. This concept is fundamental for determining reacting masses in chemical equations.
The relative atomic mass, , is the weighted mean mass of the atoms of an element compared with one twelfth of the mass of an atom of carbon-12. It is calculated by taking the sum of the mass of each isotope multiplied by its abundance, then dividing by the total abundance.
Isotopes and Atomic Notation
Atoms of the same element always possess the same number of protons in their nuclei, which defines their atomic number. However, atoms of the same element can have different numbers of neutrons. These variations are known as isotopes. The term isotope is derived from the Greek roots 'isos', meaning equal or same, and 'topos', meaning place. This reflects that isotopes occupy the same position in the Periodic Table because they are the same chemical element.
Since neutrons contribute to an atom's mass, isotopes have different mass numbers. A specific isotope is identified using standard notation, which displays the mass number () above the atomic number () next to the element symbol ().
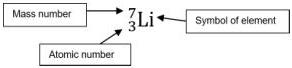
For example, hydrogen has three isotopes: protium (), deuterium (), and tritium (). While each has 1 proton, they have 0, 1, and 2 neutrons respectively.
Mass Spectrometry and Abundance
The number and relative abundances of an element's isotopes are determined using a mass spectrometer. In this device, atoms are ionised, accelerated, and then separated based on their mass-to-charge ratio () as they drift through the machine. The detected ions produce a mass spectrum.
The mass spectrum is a graph plotting the ratio on the x-axis against the number of ions (abundance) on the y-axis. The y-axis can show 'relative abundance', where the most abundant ion is set to 100% and others are scaled accordingly, or it may use 'arbitrary units'.
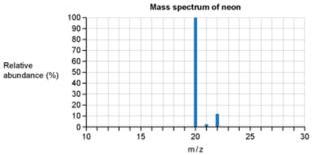
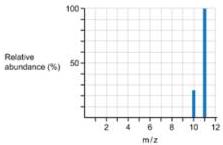
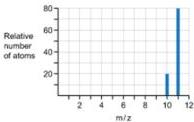
In the mass spectrum of neon shown above, there are three peaks. This indicates neon has three isotopes with mass numbers of 20, 21, and 22. In the case of boron, two peaks at 10 and 11 indicate two isotopes. If the ratio of these peaks is 1 to 4, it means there are four times as many boron-11 atoms as boron-10 atoms, corresponding to 80% and 20% abundance respectively.
The Concept of Relative Atomic Mass ()
The relative atomic mass, , is not a simple average of isotopic masses but a weighted mean. This means it accounts for how common each isotope is. The term 'relative' signifies that these masses are compared to a standard: one twelfth of the mass of a carbon-12 atom ().
Calculation from Percentage Data
If isotopic data is provided as percentages (e.g., of isotope and of isotope ), the general formula is:
Worked Example: Chlorine
A sample of chlorine contains 75% and 25% . To find the :
Calculation from Mass Spectra (Relative Abundance)
When data is presented on a mass spectrum with relative units rather than percentages, we divide by the total sum of the peak heights. If the values on the y-axis are for mass and for mass , the formula is:
Worked Example: Copper
Consider a mass spectrum for copper with peaks at 63 (height 35) and 65 (height 15).
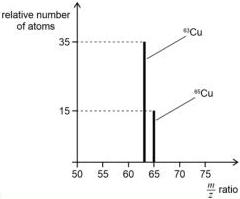
- Calculate the total number of atoms:
- Calculate the weighted sum of masses:
- Divide the sum by the total abundance:
Worked Example: Boron
In a sample showing 80% and 20% :
Key takeaways
- Isotopes are atoms of the same element with the same number of protons but different numbers of neutrons.
- A mass spectrum displays the mass-to-charge ratio () on the x-axis and relative abundance on the y-axis.
- Relative atomic mass () is the weighted mean mass of all isotopes relative to th of a carbon-12 atom.
- When using percentage abundance, divide the sum of (mass abundance) by 100.
- When using relative units from a spectrum, divide the sum of (mass abundance) by the total sum of the abundances.
When performing calculations, always perform a 'sanity check'. Your final answer must lie between the masses of the isotopes provided. For example, if you are averaging masses of 10 and 11, and your answer is 12.5, you have made a calculation error.
Be careful when the y-axis of a mass spectrum does not use percentages. You must sum all the peak heights to find the total abundance for the denominator. Do not automatically divide by 100 unless the abundances are explicitly given as percentages.
In mass spectra for diatomic molecules like , you will see peaks for both the individual atoms () and the molecules (). For , the isotopic combinations (, , , and ) create a specific 1:2:1 ratio for the molecular ion peaks at 158, 160, and 162.
Frequently asked questions
Why is the relative atomic mass of chlorine 35.5 and not a whole number?
Chlorine exists as two main isotopes, Cl-35 and Cl-37. Because it is a weighted average of these two masses based on their natural abundance (approx. 3:1 ratio), the resulting is 35.5.
Does a mass spectrum show the charge of the ions?
The x-axis represents the mass-to-charge ratio (). If an ion has a 1+ charge, the value is numerically equal to the mass of the isotope. If the charge were 2+, the peak would appear at half the mass value.
What standard is used for relative atomic mass?
All relative atomic masses are measured relative to the carbon-12 isotope, which is defined as having a mass of exactly 12.000.