Isotopes and Mass Spectrometry for the ESAT
Updated July 2026
This section covers the identification and analysis of isotopes. You will learn to define isotopes based on subatomic particles, use isotopic notation, and interpret data from a mass spectrometer. Understanding how to calculate the weighted relative atomic mass from abundance data is a critical skill for Chemistry in the ESAT.
Isotopes are atoms of the same element with equal proton numbers but differing neutron numbers. Their relative abundances are measured using mass spectrometry to calculate the weighted mean relative atomic mass ().
Defining Isotopes
All atoms belonging to a specific element possess the same number of protons in their nuclei, which is known as the atomic number. However, the number of neutrons in the nucleus of an atom of a particular element can vary. When atoms of the same element have different numbers of neutrons, they have different mass numbers. These varieties are called isotopes. The term originates from the Greek words 'isos', meaning equal, and 'topos', meaning place, reflecting the fact that isotopes occupy the same position in the Periodic Table.
A specific isotope is represented using standard notation that displays both the mass number and the atomic number alongside the element symbol.
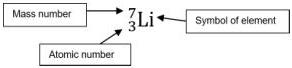
For example, hydrogen exists in three isotopic forms: , , and . Each of these contains exactly one proton. has zero neutrons, has one neutron, and has two neutrons.
Principles of Mass Spectrometry
To determine the number and relative abundance of different isotopes in a sample, chemists use a mass spectrometer. In this device, atoms or molecules are converted into positive ions through ionisation. These ions are then accelerated and separated according to their mass-to-charge ratio () as they move through the instrument. A detector records the number of ions arriving for each specific value.
The resulting mass spectrum is a graph plotting the relative number of ions on the -axis against the values on the -axis. The -axis may use arbitrary units or percentage relative abundance. If relative abundance is used, the highest peak is usually set to 100 percent, and all other peaks are scaled relative to it.
Interpreting Mass Spectra
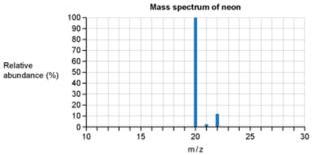
The number of peaks in a mass spectrum indicates the number of isotopes present in the sample. For instance, the mass spectrum of neon shows three distinct peaks, signifying that neon has three isotopes with mass numbers of 20, 21, and 22.
In the case of boron, the spectrum reveals two peaks at values of 10 and 11.
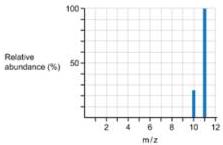
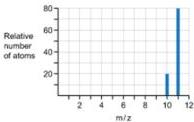
By comparing the heights of these peaks, we can determine the abundance ratio. For boron, the ratio of the peak at 10 to the peak at 11 is 1:4. This indicates that 80 percent of the atoms in this sample are boron-11 and 20 percent are boron-10.
Relative Atomic Mass Calculations
The relative atomic mass () is the weighted mean of the mass numbers of all isotopes of an element. This value is calculated relative to 1/12th of the mass of a carbon-12 atom. Because it is a ratio, does not have units.
When data is provided as percentages, use the following formula:
If the data is provided as relative abundances from a mass spectrum, use the sum of the abundances in the denominator:
Worked Example: Chlorine
Consider a sample of chlorine where 75 percent of the atoms are and 25 percent are . The calculation for the relative atomic mass is:
Worked Example: Copper
Using the mass spectrum of copper below, we can calculate its relative atomic mass.
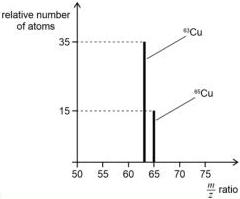
The -axis shows 35 units for mass 63 and 15 units for mass 65. The total relative abundance is .
Analyzing Molecular Spectra
When dealing with diatomic molecules like bromine (), the mass spectrum is more complex. Single bromine atoms () appear as peaks at 79 and 81 in equal heights, showing a 1:1 ratio. However, molecular ions () appear at 158, 160, and 162. These result from different combinations of the two isotopes. Because there are two ways to form a molecule with a mass of 160 ( and ), that peak is twice as high as the peaks for 158 () and 162 ().
Key takeaways
- Isotopes are atoms with identical proton numbers but different neutron numbers, resulting in different mass numbers.
- The mass spectrum provides the ratio of ions and their relative abundances, represented by peak heights.
- The relative atomic mass () is a weighted average of isotopic masses compared to 1/12th the mass of carbon-12.
- To calculate from a spectrum, multiply each isotopic mass by its abundance, sum these values, and divide by the total abundance.
When calculating relative atomic mass from a spectrum, always check your denominator. If the -axis shows percentages, the total will be 100. If the -axis shows relative heights like 3:1, the total is 4. Always use the total sum of the heights provided.
Be careful when reading the scale on the -axis. Ensure you are looking at atomic ions rather than molecular ions if you are asked to identify isotopes of an element. For example, in a bromine spectrum, peaks around 80 are atoms, while peaks around 160 are molecules.
The standard for relative atomic mass is specifically the carbon-12 isotope. This choice is the international standard, meaning the mass of one atom of is exactly 12 units. All other atomic masses are measured relative to this constant.
Frequently asked questions
Why do isotopes of the same element have the same chemical properties?
Chemical properties are determined by the number and arrangement of electrons. Since isotopes of the same element have the same number of protons, they also have the same number of electrons in a neutral atom, leading to identical chemical behaviour.
What is the difference between mass number and relative atomic mass?
The mass number is an integer representing the sum of protons and neutrons in a single specific atom. The relative atomic mass () is a weighted average of the mass numbers of all naturally occurring isotopes of that element, often resulting in a non-integer value.
How do you identify the number of isotopes from a mass spectrum?
Each distinct peak on the -axis (the axis) that corresponds to a single atom ion represents a different isotope of that element.