Gradients and Areas Under Graphs for the ESAT
Updated July 2026
This topic covers the calculation of gradients for both linear and non-linear graphs and the estimation of areas beneath them. Mastering these techniques is essential for the ESAT as they allow students to interpret real-world data in kinematics and finance, such as determining speed from a distance-time graph or distance from a speed-time graph.
The gradient of a graph represents the rate of change between two variables, while the area between the graph and the horizontal axis represents the accumulated product of those variables.
Gradient of straight-line graphs
The gradient of a straight-line graph is a measure of its steepness and represents the rate of change of the vertical variable with respect to the horizontal variable. For a line with the equation , the gradient is the constant .
To calculate the gradient of a straight line passing through two specific points, and , we use the formula:
Worked Example: Straight-line Gradient
Find the gradient of the line segment shown in the following diagram:
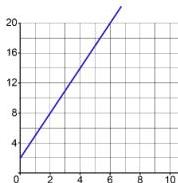
To solve this, we pick two points on the line where the coordinates are easy to read, preferably integer values.
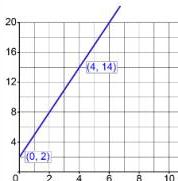
In this example, the points and are chosen. Using the gradient formula:
Gradient of curves
The gradient of a curve at a specific point is not constant; it changes as you move along the graph. The gradient at any given point is equal to the gradient of the tangent to the curve at that point. A tangent is a straight line that touches the curve at a single point and has the same slope as the curve at that point.
Consider the curve and the tangent at the point . This tangent also passes through .
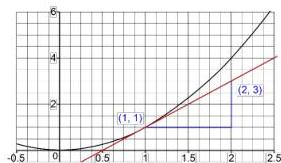
The gradient of this tangent is calculated as:
Therefore, the gradient of the curve at the point is .
Worked Example: Gradient of a Curve at a Point
Find the gradient of the curve at the point .
First, draw the curve using a large scale for the range . Plot several points to ensure accuracy:
Next, draw a tangent at the point . To do this accurately, place a ruler across the curve so that an equal amount of the curve is visible on either side of the point . Slide the ruler toward the point while maintaining this balance until you reach it.
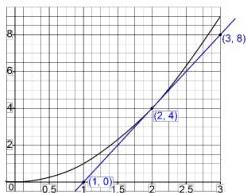
Now, pick two points on this tangent line. In the diagram, the points and are selected. The gradient of the tangent, and thus the curve at , is:
Area under a straight-line graph
The phrase area under a graph refers to the region enclosed between the graph and the horizontal axis. For straight-line graphs, this area consists of simple geometric shapes such as triangles, rectangles, and trapezia. The total area is found by summing the areas of these individual shapes.
Worked Example: Compound Area
Find the area under the graph shown below:
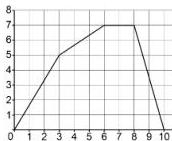
We divide the area into sections that are easy to calculate:
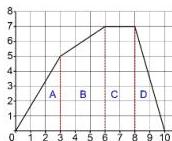
- Area of triangle A:
- Area of trapezium B:
- Area of rectangle C:
- Area of triangle D:
The total area is units squared.
Approximate areas under curves
To estimate the area between a curve and an axis, the region is divided into vertical strips perpendicular to the axis. These strips are usually treated as trapezia or triangles to fit the curve as closely as possible. The strips do not need to have the same width.
Worked Example: Estimating Area Under a Curve
Find the approximate area under the curve for , giving the answer to decimal place.
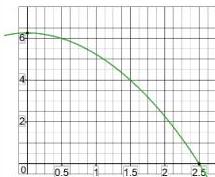
We divide the area into two trapezia (A and B) and one triangle (C):
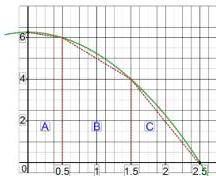
- Area of trapezium A (width , heights and ):
- Area of trapezium B (width , heights and ):
- Area of triangle C (width , height ):
Total approximate area is , which is units squared correct to decimal place.
Interpretation of gradient and area
Gradients and areas have specific physical meanings depending on what is plotted on the axes.
Gradient
If distance is on the vertical axis and time is on the horizontal axis, the gradient represents speed because:
Area Under a Curve
If speed is on the vertical axis and time is on the horizontal axis, the area under the graph represents the distance travelled because:
Worked Example: Speed-Time Graph
A car travels from Jai's home to his grandfather's house. The speed-time graph of the journey is shown below:
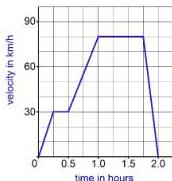
To find the total distance, we calculate the area under the graph by splitting it into five sections:
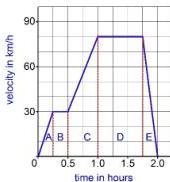
- Area of triangle A:
- Area of rectangle B:
- Area of trapezium C:
- Area of rectangle D:
- Area of triangle E:
Total distance is km.
Key takeaways
- The gradient of a curve at a point is found by drawing a tangent and calculating its slope.
- The area under a graph always refers to the region between the curve and the horizontal axis.
- In a speed-time graph, the gradient represents acceleration and the area represents total distance.
- Complex areas under graphs can be approximated by summing the areas of vertical trapezia and triangles.
When calculating gradients from a graph, always try to find two points that fall exactly on the grid intersections (integer coordinates) to avoid rounding errors early in your calculation.
Be careful with units, especially in speed-time graphs. If speed is in km/h and time is in minutes, you must convert the time to hours before calculating the area to find the distance in kilometres.
Calculating the gradient of a curve at a point is the graphical equivalent of differentiation, while finding the area under a curve is the graphical equivalent of integration.
Frequently asked questions
How do I ensure my tangent line is accurate?
Use a ruler and place it so that an equal amount of the curve is visible on both sides of the target point. This visual balance ensures the ruler's slope matches the curve's slope at that exact point.
Must all strips used to approximate an area have the same width?
No. When approximating areas under curves, you can choose strips of different widths to better fit the shape of the curve and improve accuracy.
What does a negative gradient represent on a distance-time graph?
A negative gradient indicates that the distance from the starting point is decreasing, which means the object is moving back toward its origin.