Interpreting Graphs and Non-Standard Functions
Updated July 2026
This section covers the interpretation of straight line, reciprocal, exponential, and non-standard graphs within real-world contexts. You will learn to extract constants of proportionality, calculate rates of change, and solve kinematic problems. Understanding these graphical relationships is vital for modelling physical and economic scenarios in the ESAT.
Graphical interpretation involves identifying the underlying mathematical model, such as or , and using specific data points to determine constants and predict outcomes.
Straight Line Graphs
Straight line graphs are fundamental in representing linear relationships. When a straight line passes through the origin, , it represents a simple proportional relationship. Common examples include the cost of items when there is no bulk-buying discount, distance travelled when moving at a constant speed, or currency exchange rates without an administration fee.
If the straight line does not pass through the origin, it typically represents a scenario with an initial charge or fixed value followed by a proportional relationship. An example of this is a mobile phone contract with a fixed monthly fee plus a cost per minute of calls.
Worked Example: Poster Printing
The cost of printing a poster consists of an initial set-up fee plus a fixed cost for each poster printed.
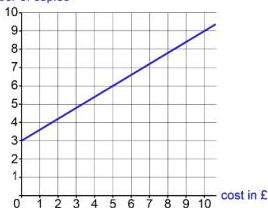
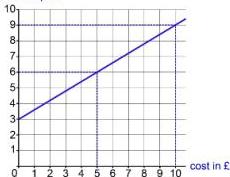
To find the set-up cost from the graph, we look at the value of the cost when the number of copies is zero. From the graph, the y-intercept is at 3, so the set-up cost is £3.
To calculate the cost of printing 500 posters, we first need the cost per poster (the gradient). We identify a clear point on the graph, such as .
- Calculate the cost of printing 1 copy: The change in cost for 10 copies is . Therefore, the cost per copy is .
- Calculate the total cost for 500 copies: This is the set-up fee plus the cost of the copies. Total cost = .
Reciprocal Graphs
Reciprocal graphs take the form and are used to model inverse proportion. In these scenarios, as one variable increases, the other decreases such that their product remains constant ().
Worked Example: Pressure and Volume
The graph below shows the pressure in atmospheres, , plotted against the volume, , of a gas in litres.
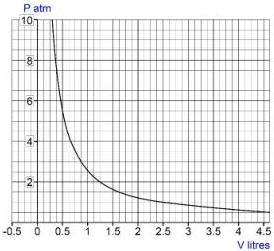
To determine if is inversely proportional to , we test if . We can find the constant by looking at the graph where . At , , suggesting .
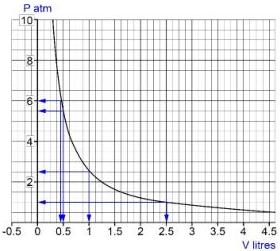
We must then verify that for several other points on the graph:
| P | V | PV (to 1 d.p.) |
|---|---|---|
| 1.0 | 2.50 | 2.5 |
| 2.5 | 1.00 | 2.5 |
| 5.0 | 0.50 | 2.5 |
| 6.0 | 0.42 | 2.5 |
Since the product is consistently 2.5, it is reasonable to deduce that is inversely proportional to with the equation .
Exponential Graphs
Exponential curves of the form model growth or decay where a quantity changes by the same factor in every time period. For example, a population that doubles every year follows an exponential growth model.
Worked Example: Bacterial Growth
An experiment measures the growth of a bacterial colony where the relationship between the number of thousands of bacteria, , and time in hours, , is .
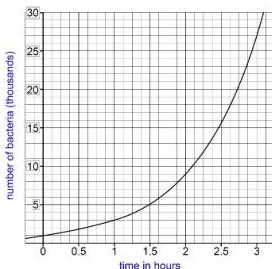
At the start of the experiment (), the graph shows , which represents 1000 bacteria. After 1 hour, (3000 bacteria). After 2 hours, (9000 bacteria). After 3 hours, (27,000 bacteria).
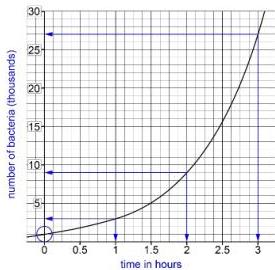
Because the population is multiplied by 3 every hour, the growth factor is 3, and the equation is . At the end of the 4th hour, there will be bacteria.
Non-standard Graphs
Non-standard graphs often combine different lines and curves. These are frequently seen as travel graphs (distance-time graphs) representing different stages of a journey.
Worked Example: Ania's Journey
The distance-time graph shows Ania's journey from home to school. School is 1 km from her house.
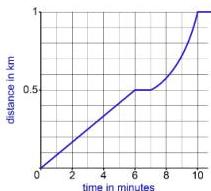
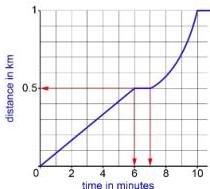
- Distance to the shop: The graph is flat when Ania stops moving. This happens at 0.5 km, which is 500 metres.
- Waiting time: The graph is flat between minute 6 and minute 7, so she waits for 1 minute.
- Graph shape (Home to Shop): The journey is a straight line because the distance is increasing at a constant rate, meaning she walks at a constant speed.
- Walking speed: She walks 500 m in 6 minutes. Speed = m/min.
- Graph shape (Shop to School): The curve between 7 and 10 minutes indicates that she is moving at a non-constant speed. Since the slope is increasing, she is accelerating.
- Average speed (Shop to School): She covers the remaining 500 m in 3 minutes. Average speed = m/min.
Key takeaways
- A straight line through the origin represents direct proportion, while a non-zero y-intercept indicates an initial fixed cost or value.
- Reciprocal graphs of the form represent inverse proportion where the product of the variables remains constant.
- Exponential growth graphs are identified by a constant multiplying factor for each unit increase in the horizontal axis.
- In distance-time graphs, the gradient represents speed: a straight line indicates constant speed, a flat line indicates being stationary, and a curve indicates acceleration or deceleration.
When asked to find values from a non-standard graph, use a ruler to align points with the axes to ensure your approximate solutions are as accurate as possible. Always check the units on the axes, such as kilometres versus metres, or minutes versus hours.
Do not assume a graph is a simple reciprocal or exponential curve without checking at least three points. A curve might look like but actually represent a different non-standard function.
The gradient of a distance-time graph represents velocity, while the gradient of a velocity-time graph represents acceleration. In non-standard curves, the instantaneous speed at any point is the gradient of the tangent to the curve at that point.
Frequently asked questions
How do I find the constant in a reciprocal graph from a diagram?
Pick a clear point on the curve and multiply the coordinates together. Since , it follows that . It is best to check multiple points to ensure the relationship holds.
What does an increasing gradient signify on a distance-time graph?
An increasing gradient (a curve getting steeper) indicates that the speed is increasing, which means the object is accelerating.
How can I distinguish between and on a graph?
is a straight line passing through the origin, where adding 1 to always adds to . is a curve passing through , where adding 1 to multiplies by a factor of .