Trigonometric Graphs and Periodic Functions
Updated July 2026
Learn to master the sine, cosine, and tangent functions for the ESAT. This guide covers their graphical representations, symmetries, and periodicities, alongside their interpretation as projection operators. Understanding these foundations is essential for solving complex trigonometric equations and transformations in Advanced Mathematics.
Trigonometric functions are periodic mappings that relate angles to coordinate projections: and repeat every (), while repeats every ().
The Fundamental Graphs of Sine and Cosine
The sine and cosine functions are periodic, meaning they repeat their values in regular intervals. For and , the period is or radians. When sketching these functions, it is vital to recognise their specific symmetries. The sine function is an odd function, meaning it has rotational symmetry about the origin: . The cosine function is an even function, meaning it has reflectional symmetry in the axis: .
When sketching over large ranges, such as , you will see four complete cycles of the wave. Over the range , you will see two complete cycles. On the same axes, and intersect where their values are equal. In the range , occurs at and . These correspond to where . Conversely, occurs where , which are the values and .
Graph Transformations: Amplitude and Period
Modifying the basic trigonometric functions changes their physical appearance on a graph.
-
Vertical Stretching: In the function , the number 2 is the amplitude. The graph is stretched vertically by a factor of 2, so the peaks reach 2 and the troughs reach -2.
-
Horizontal Compression: In the function , the number 2 affects the frequency. The graph is compressed horizontally by a factor of 2, meaning the period is halved from to (or ).
Phase Shifts and Compound Transformations
When a constant is added inside the argument of the function, it results in a horizontal shift (a phase shift). However, the way the constant is written significantly changes the result. Consider these four examples over the range :
- : Here, the period is and the graph is shifted to the left. The shift is not . To find the shift, we set the argument to zero: , which gives .
- : This is shifted to the right by .
- : Because the 2 is factorised out, the horizontal shift is exactly to the left.
- : This is shifted exactly to the right.
Trigonometric Functions as Projection Operators
A powerful way to understand sine and cosine is to view them as projection operators. They project a line of positive length at an angle onto the axes. The cosine function projects the line onto the axis, while the sine function projects the line onto the axis.
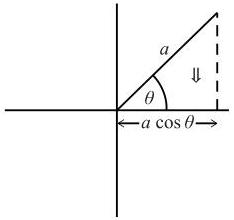
In the diagram above, the horizontal projection is . Because is an acute angle in the first quadrant, is positive.
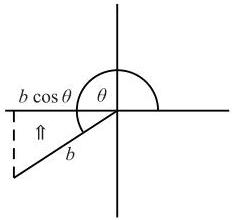
In the second diagram, the angle is obtuse (between and ). Here, the projection onto the axis points in the negative direction, so the value is negative.
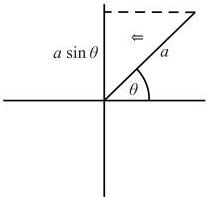
For sine, the projection is onto the axis. In the third diagram, where the angle is in the first or second quadrant, the vertical projection is positive.
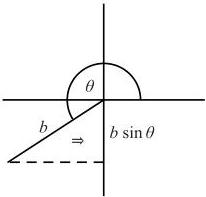
In the fourth diagram, if the angle is between and , the vertical projection points downwards, making the value negative. This logic explains the sign of trigonometric functions across the four quadrants of a CAST diagram.
The Tangent Function and Projections
The tangent function converts a projection on the axis into a projection on the axis. We can express this relationship as .
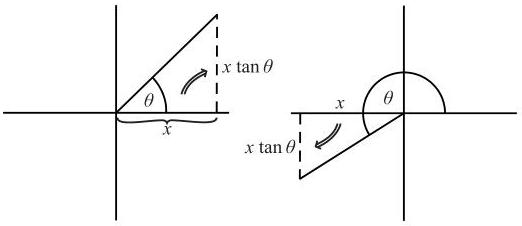
In the first diagram, both and are positive, so is positive. In the second diagram, if is negative and is positive (second quadrant), the relationship implies that must be negative. Between and , is indeed negative. Similarly, between and (fourth quadrant), is positive and is negative, so remains negative. This demonstrates how tangent represents the gradient of the line at angle .
Key takeaways
- Sine and Cosine have a period of (), while Tangent has a period of ().
- Cosine is an even function (y axis symmetry), whereas Sine and Tangent are odd functions (origin symmetry).
- In the form , the period is and the horizontal shift is .
- Cosine represents the x projection and Sine represents the y projection of a line of length at angle .
When sketching trigonometric functions, always label the key intercepts on the and axes and mark the coordinates of the maximum and minimum points to demonstrate your understanding of the period and amplitude.
Be extremely careful with horizontal shifts. A common mistake is to assume the shift of is . You must always divide the constant by the coefficient of to find the true shift, which in this case is to the left.
The periodicity of trigonometric functions allows us to find infinite solutions to equations. By knowing the symmetry of the graphs, you can find every solution within any given range by using the 'principal value' from your calculator and applying the properties of the unit circle projections.
Frequently asked questions
What is the difference between and ?
The graph is a vertical stretch with an amplitude of 2. The graph is a horizontal compression, meaning it completes a full cycle in instead of .
How do you find the horizontal shift of ?
Set the argument to zero: . Solving for gives . Thus, the graph is shifted units to the right.
Why does the tangent graph have asymptotes?
The tangent function is defined as . At , , and other odd multiples of , . Since division by zero is undefined, the graph has vertical asymptotes at these values.
Where do and intersect in the range to ?
They intersect where , which means . This occurs at (Quadrant 1) and (Quadrant 3).